Generate a heatmap into a panoramic image in python from data collected in Pupil Labs Eye Tracker
In this tutorial we will generate a heatmap in python into a panoramic image from eye tracking data.
Requirements
-Panoramic Image created from your VR task
-Data in a csv format
-Timestamps included in your data
-Anconda Python Development Environment
-Data in a csv format
-Timestamps included in your data
-Anconda Python Development Environment
Step 1 Panoramic Image
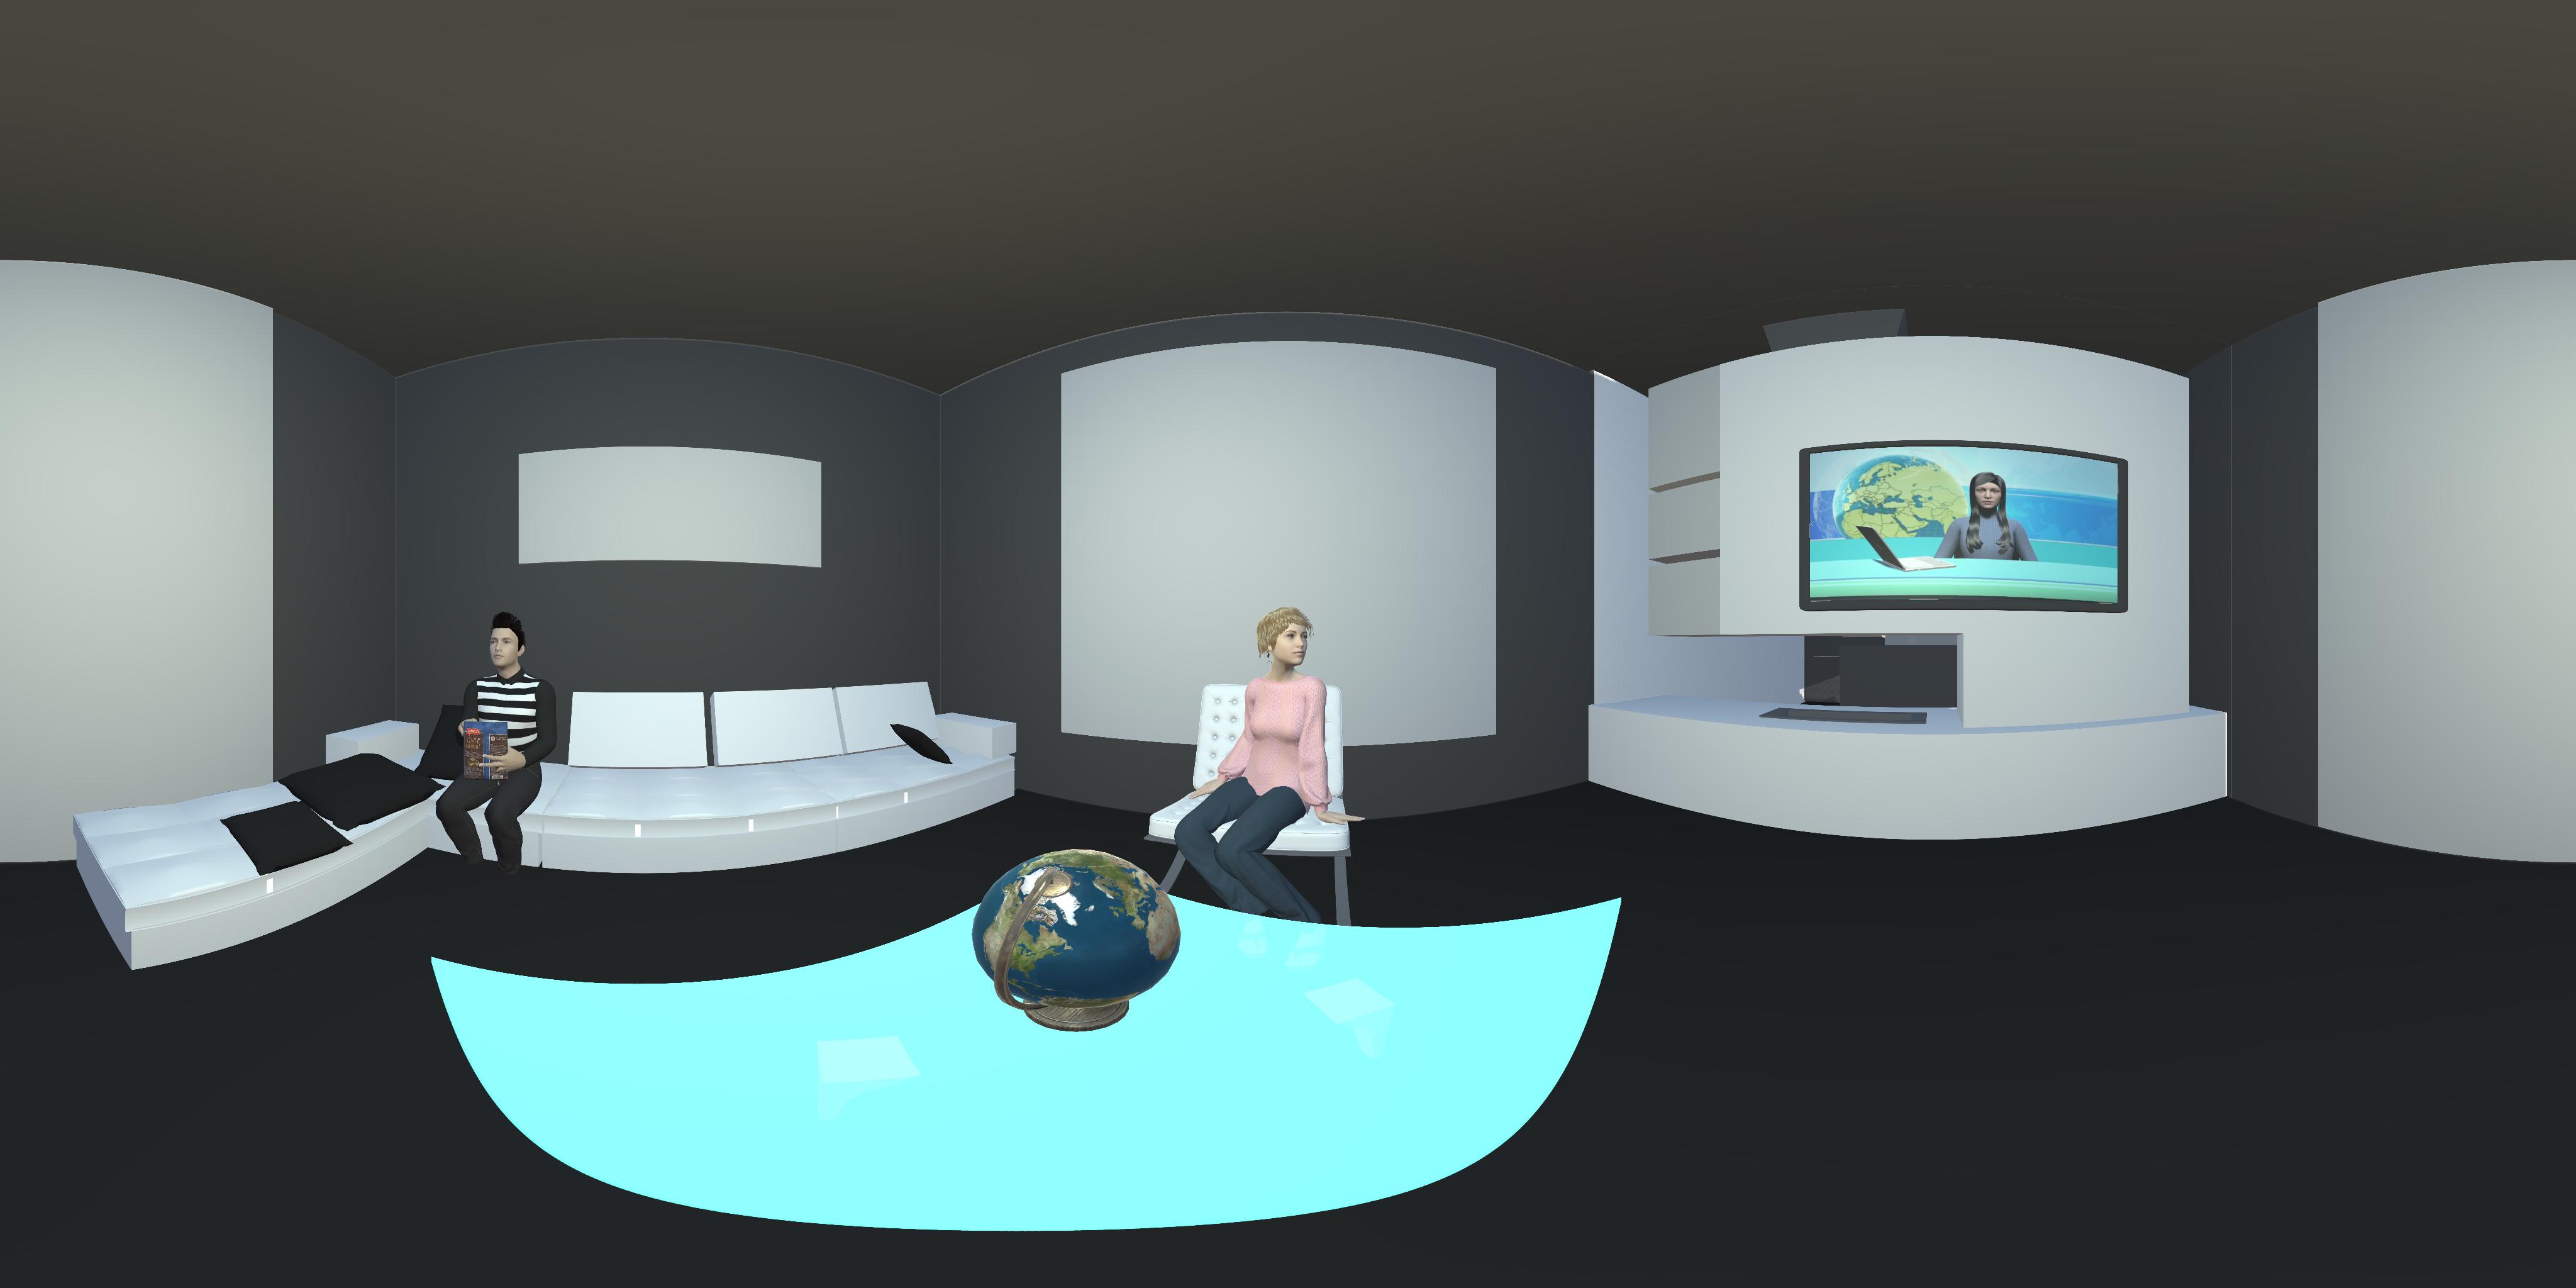
Let's assume that we have created a task in VR and from this task we generated a panoramic image of the whole 3D environment.
For this tutorial I created a task in Unity in VR and I generated from Unity a panoramic image. If you are interested to create a VR task in Unity for research have a look at my course Build Complete VR App in Unity with Eye Tracking & EEG.
For this task users had to focus on the tv and the topic that the news reporter would talk about.
From the task that I am using for this tutorial, I generated this panoramic image which I have named PanoramaSc1.jpg:
Step 2 Data
Let's assume that we have pupil labs eye tracker and we collected a large volume of data from users eyes and we also have the panoramic image.
We want now to generate the heatmap from fixations data. Heatmaps are generated during fixations.
The fixations file has two important variables that we will use for this tutorial which are:
Download Fixations CSV File
"norm_pos_x" and "norm_pos_y" Those variable are x y position in the world image frame in normalized coordinates. We will need the normalized coordinates to intersect those with image coordinates. Have a look at the fixations data that we have collected for this specific user in this task from the eye tracker:Step 3 Python Setup
To write a python script we need a platform. We can use Spyder although there are other platforms to write python scripts. I like to use Spyder because it works fast in large volumes of data. To have access to spyder it is recommended to download first Anaconda.
After the download has been completed, you can run Anaconda and lunch Spyder. If the launch button does not show but an Install button shows instead, make sure to install Spyder and then run it.
After you open Spyder, you can create a new file and save the file in the same directory where your data and panoramic image is located. Now we are ready to start coding.
Step 4 Generate heatmap into panoramic image from fixations data.
Now we can write a python script that utilizes the norm_pos_x and norm_pos_y to generate the heatmap. IMPORTANT: The two lines of the code below:
gaze_on_surf_x = dataGaze.norm_pos_x + 0.12 ,
gaze_on_surf_y = dataGaze.norm_pos_y + .15 Need to be changed according to the part of the image that was in front of the user in VR. Therefore you need to change those coordinates 0.12 and .15 to position the heatmap in the area or part of the image that was in front of the user in VR.
                                        """
                                        @author: Fjorda
                                        """
                                        import numpy as np
                                        import matplotlib.pyplot as plt
                                        from scipy.ndimage.filters import gaussian_filter
                                        import pandas as pd
                                        pd.options.display.float_format = '{:.3f}'.format
                                        ##################     Original Image  #######################
                                        cover_img = plt.imread('PanoramaSc1.jpg')

                                        print("Cover Reference Image")
                                        plt.figure(figsize=(8,8))
                                        plt.imshow(cover_img)
                                        plt.axis('off');

                                        ##################     Heat mapp image  #######################
                                        dataGaze = pd.read_csv('fixations.csv')
                                        heads    = dataGaze .columns

                                        gaze_on_surf_x = dataGaze.norm_pos_x + 0.12 # gaze_point_3d_x
                                        gaze_on_surf_y = dataGaze.norm_pos_y + .15 #norm_pos_y

                                        grid = cover_img.shape[0:2] # height, width of the loaded image
                                        heatmap_detail = 0.05 # this will determine the gaussian blur kerner of the image (higher number = more blur)

                                        # flip the fixation points
                                        # from the original coordinate system,
                                        # where the origin is at botton left,
                                        # to the image coordinate system,
                                        # where the origin is at top left
                                        gaze_on_surf_y = 1 - gaze_on_surf_y

                                        # make the histogram
                                        hist, x_edges, y_edges = np.histogram2d(
                                            gaze_on_surf_y,
                                            gaze_on_surf_x,
                                            range=[[0, 1.0], [0, 1.0]],
                                            normed=False,
                                            bins=grid
                                        )

                                        # gaussian blur kernel as a function of grid/surface size
                                        filter_h = int(heatmap_detail * grid[0])# // 2 * 2 + 1
                                        filter_w = int(heatmap_detail * grid[1])# // 2 * 2 + 1
                                        heatmap = gaussian_filter(hist, sigma=(filter_w, filter_h), order=0)

                                        # display the histogram and reference image
                                        print("Cover image with heatmap overlay")
                                        plt.figure(figsize=(20,20))
                                        plt.imshow(cover_img)
                                        plt.imshow(heatmap, cmap='jet', alpha=0.5)
                                        plt.axis('off');
After we run the above script, we now have generated the heatmap from fixations data into a panoramic image (see below).
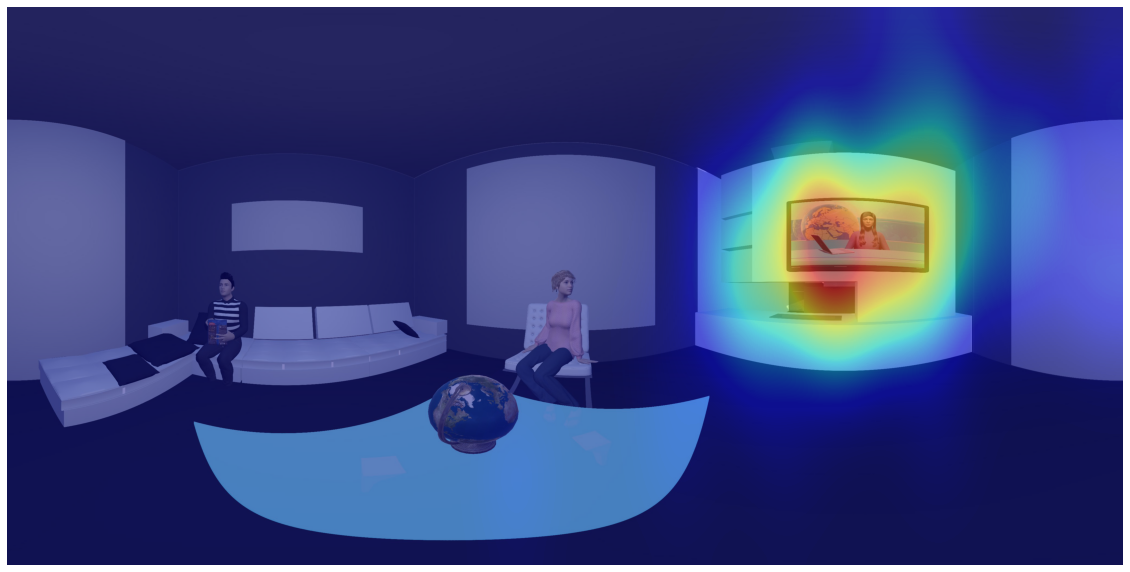