AOI Transitions and Dwell Time in Python using Pupil Labs Eye Tracking
This guide explains how to quantify attention inside and outside an AOI using fixation data exported from a Pupil Labs eye tracker.
By the end, you will generate:
- An AOI membership timeline by fixation order
- A dwell-time comparison chart (AOI vs elsewhere)
- A transition matrix showing how attention switches between regions
Note. This code works with Pupil Labs CSV exports (especially
Download Fixations CSV File
Download Panorama Image
By the end, you will generate:
- An AOI membership timeline by fixation order
- A dwell-time comparison chart (AOI vs elsewhere)
- A transition matrix showing how attention switches between regions
Note. This code works with Pupil Labs CSV exports (especially
fixations.csv). The code uses a panorama image captured in VRDownload Fixations CSV File
Download Panorama Image
Requirements
- Anaconda Python Development Environment
- CSV files exported from Pupil Labs
- Optional panorama image (recommended for visual interpretation)
- Python packages:
-
-
-
-
- CSV files exported from Pupil Labs
- Optional panorama image (recommended for visual interpretation)
- Python packages:
-
pandas-
numpy-
matplotlib-
Pillow (usually included with Anaconda; used for reading images and writing image files)
Setup
1. Install Anaconda if needed.
2. Open Spyder, Jupyter Notebook, or VS Code.
3. Put the files in your working folder:
-
- optional: a panorama image file (for example, a panorama or screenshot)
4. Save the script as
To use Spyder, install Anaconda, run it, and launch Spyder. If you see Install instead of Launch for Spyder, install Spyder first. Create a new file in Spyder and save it in the same directory as your data when you run the examples below.
2. Open Spyder, Jupyter Notebook, or VS Code.
3. Put the files in your working folder:
-
fixations.csv (required)- optional: a panorama image file (for example, a panorama or screenshot)
4. Save the script as
aoi_transitions_dwell.py in the same folder (or a folder of your choice and pass paths on the command line).To use Spyder, install Anaconda, run it, and launch Spyder. If you see Install instead of Launch for Spyder, install Spyder first. Create a new file in Spyder and save it in the same directory as your data when you run the examples below.
Step 1 Data
We start with fixation events exported by Pupil Labs.
Important variables from
-
-
-
-
Important variables from
fixations.csv: -
start_timestamp: fixation start time (used for temporal order) -
duration: fixation duration in milliseconds (used for dwell-time totals) -
norm_pos_x, norm_pos_y: normalized fixation coordinates (used for AOI classification) -
confidence: fixation confidence (used to optionally filter low-quality fixations) Step 2 Define AOI Membership
In this step, you:
1. Load
2. Convert normalized fixation coordinates into panorama pixel coordinates
3. Define AOI pixel boundaries
4. Classify each fixation as
This creates a region label sequence that can be used for dwell and transition analysis.
1. Load
fixations.csv2. Convert normalized fixation coordinates into panorama pixel coordinates
3. Define AOI pixel boundaries
4. Classify each fixation as
AOI or ElsewhereThis creates a region label sequence that can be used for dwell and transition analysis.
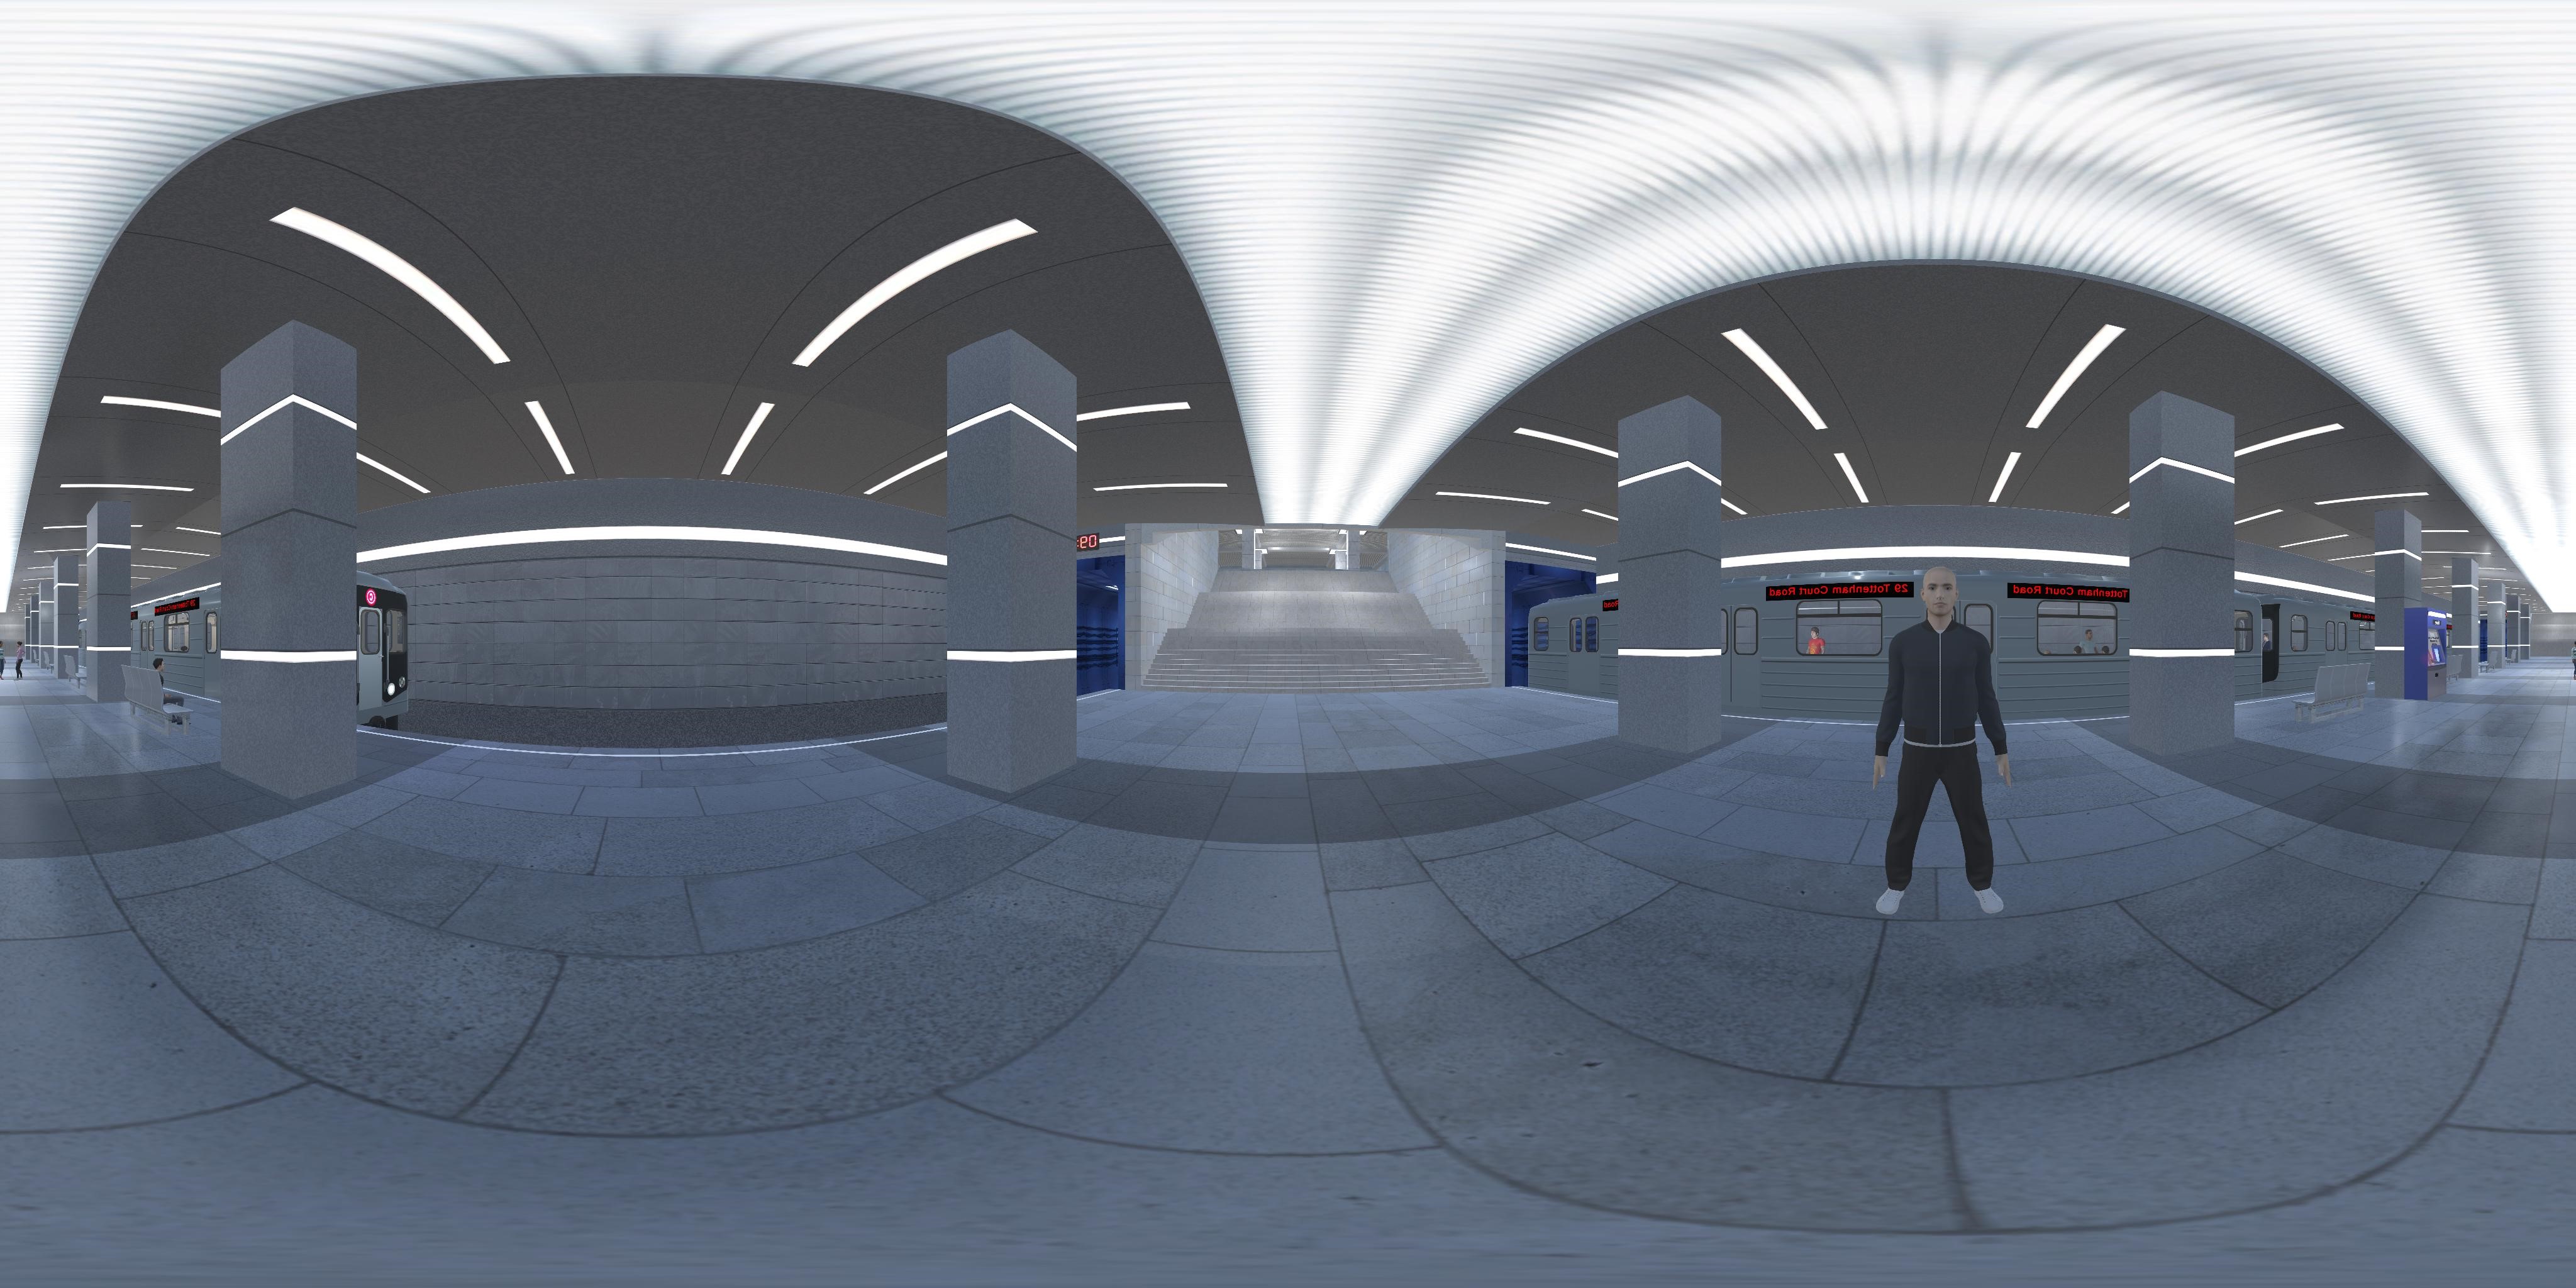
Panorama image and AOI definition
Download the panorama image for this tutorial provided above.
How this AOI was defined for the tutorial: The panorama used in the reference analysis is 4096 × 2048 pixels (width × height). The avatar region is a rectangle in pixel coordinates of the original image, with the origin at the top-left (x increases to the right, y increases downward): left = 885, right = 1162, top = 873, bottom = 1158. The script scales these numbers to match the actual width and height of your
Getting these coordinates in Adobe Illustrator: Open the image at full resolution and confirm the document size in pixels. Set Units to Pixels (for example Edit → Preferences → Units on Windows, or Illustrator → Settings → Units on Mac). Use the Rectangle Tool to draw a box over the region of interest. With the rectangle selected, read X, Y, W, and H in the Transform panel (or use Window → Info while adjusting the shape). Convert to left / right / top / bottom in pixels if needed (for example: right = left + width, bottom = top + height).
How this AOI was defined for the tutorial: The panorama used in the reference analysis is 4096 × 2048 pixels (width × height). The avatar region is a rectangle in pixel coordinates of the original image, with the origin at the top-left (x increases to the right, y increases downward): left = 885, right = 1162, top = 873, bottom = 1158. The script scales these numbers to match the actual width and height of your
--image file when you run it.Getting these coordinates in Adobe Illustrator: Open the image at full resolution and confirm the document size in pixels. Set Units to Pixels (for example Edit → Preferences → Units on Windows, or Illustrator → Settings → Units on Mac). Use the Rectangle Tool to draw a box over the region of interest. With the rectangle selected, read X, Y, W, and H in the Transform panel (or use Window → Info while adjusting the shape). Convert to left / right / top / bottom in pixels if needed (for example: right = left + width, bottom = top + height).
Step 2.1 Compute Dwell and Transition Metrics
In this step, you compute region-level behavior metrics from the AOI labels:
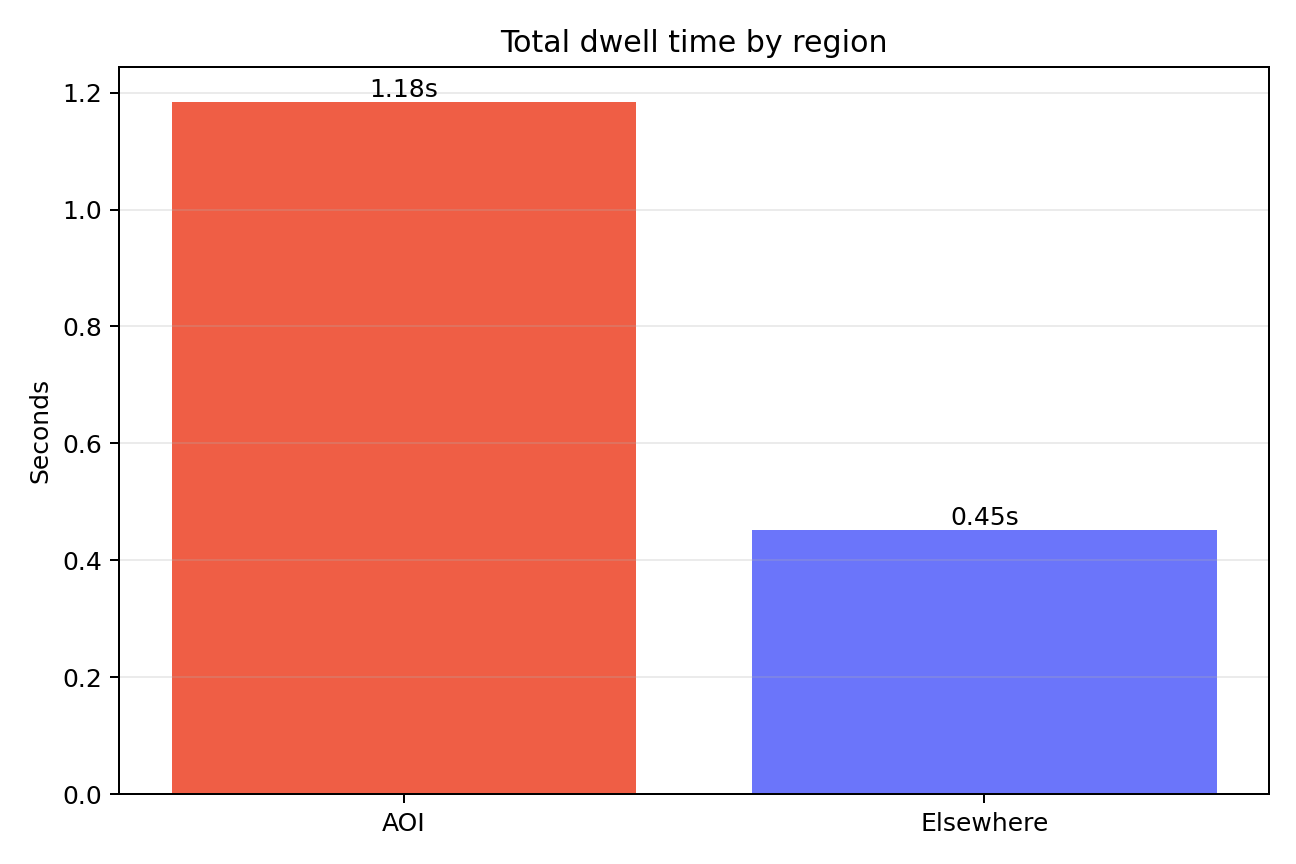
1. Total dwell time in AOI versus elsewhere
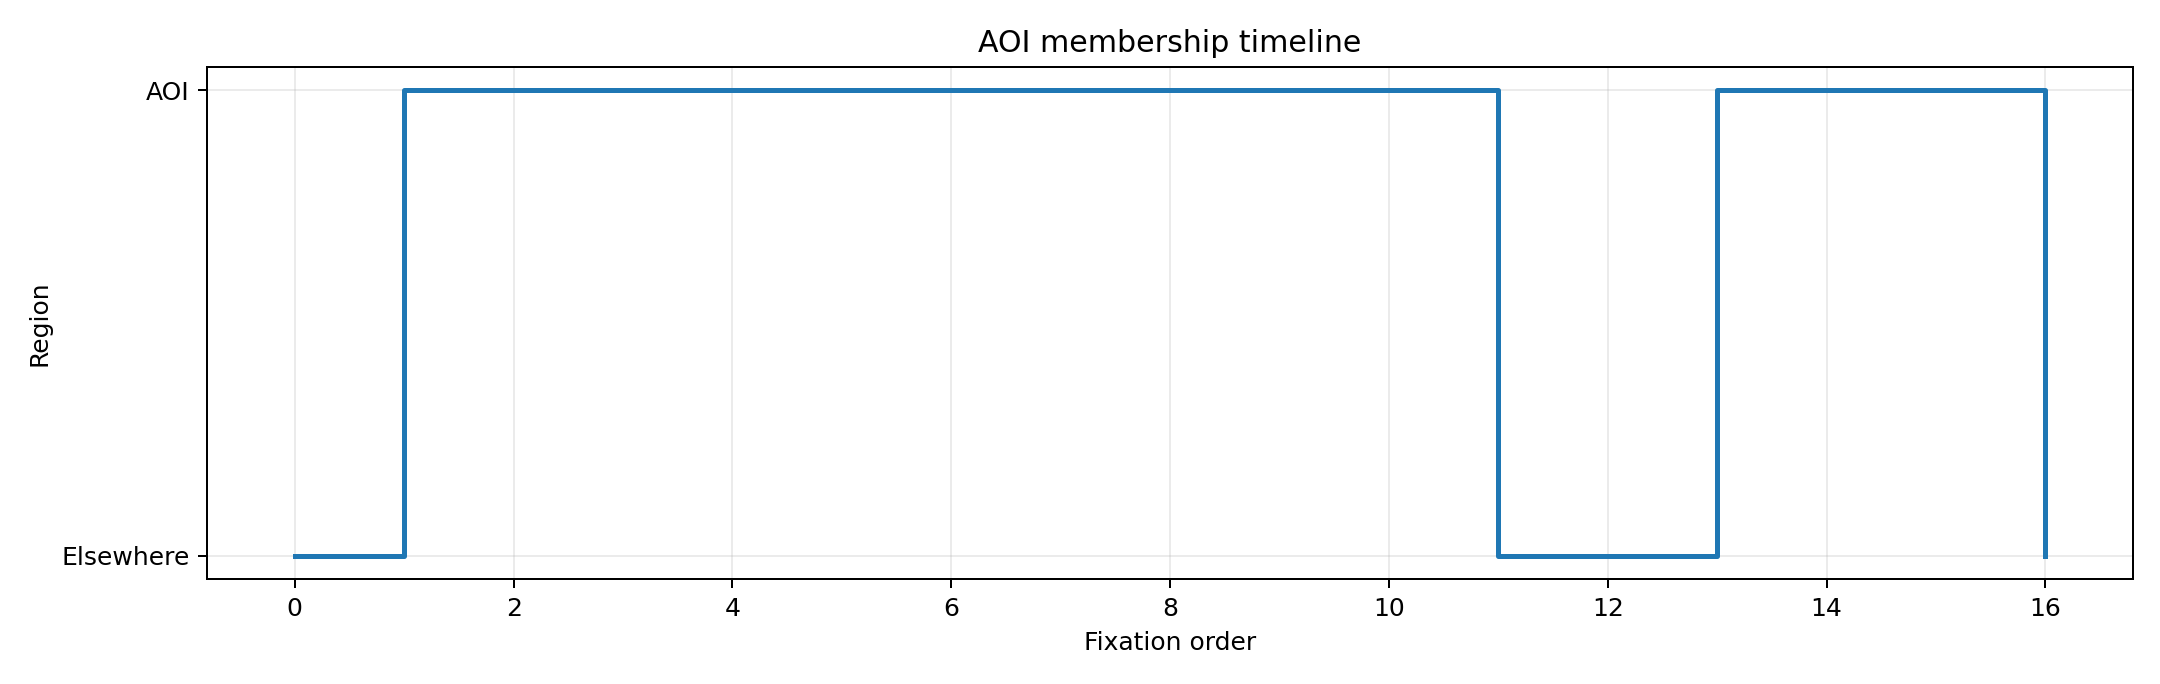
2. AOI membership timeline over fixation order
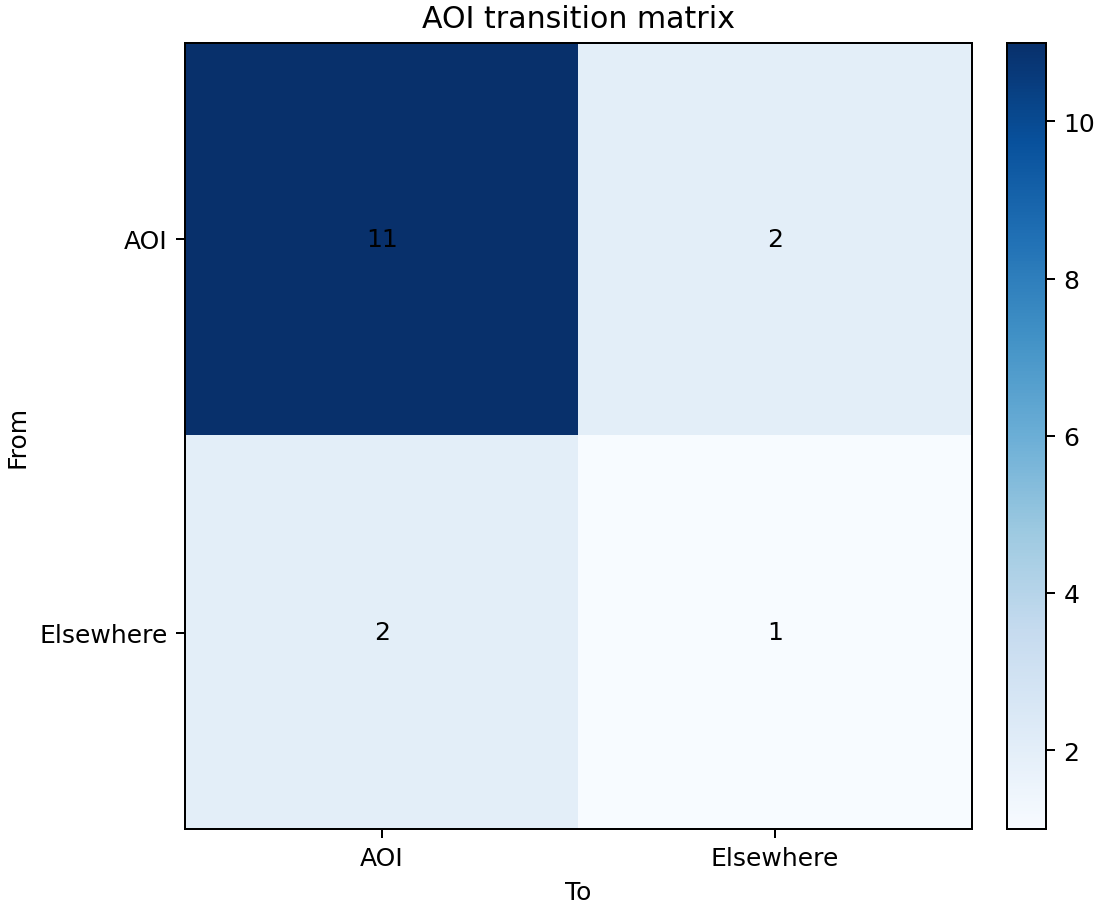
3. Transition counts between AOI and elsewhere
4. Transition matrix visualization for quick interpretation
Learning outcome: you can connect where fixations land with how attention shifts over time.
1. Total dwell time in AOI versus elsewhere
2. AOI membership timeline over fixation order
3. Transition counts between AOI and elsewhere
4. Transition matrix visualization for quick interpretation
Learning outcome: you can connect where fixations land with how attention shifts over time.
Step 3 Generate AOI Transition and Dwell Outputs
1. Generate AOI membership timeline
2. Generate dwell-time comparison plot
3. Generate AOI transition matrix
Additional optional visuals can be generated to support interpretation.
2. Generate dwell-time comparison plot
3. Generate AOI transition matrix
Additional optional visuals can be generated to support interpretation.
Step 4 Run the Script
Option A (portable, minimal) — put
Option B (custom AOI coordinates)
Expected output files (saved automatically to your tutorial output folder):
-
-
-
-
-
-
fixations.csv in the same folder as the script and run:python aoi_transitions_dwell.py --fixations "fixations.csv"Option B (custom AOI coordinates)
python aoi_transitions_dwell.py --fixations "fixations.csv" --aoi-left 2933 --aoi-right 3210 --aoi-top 873 --aoi-bottom 1158Expected output files (saved automatically to your tutorial output folder):
-
aoi_membership_timeline.png-
aoi_dwell_time.png-
aoi_transition_matrix.png-
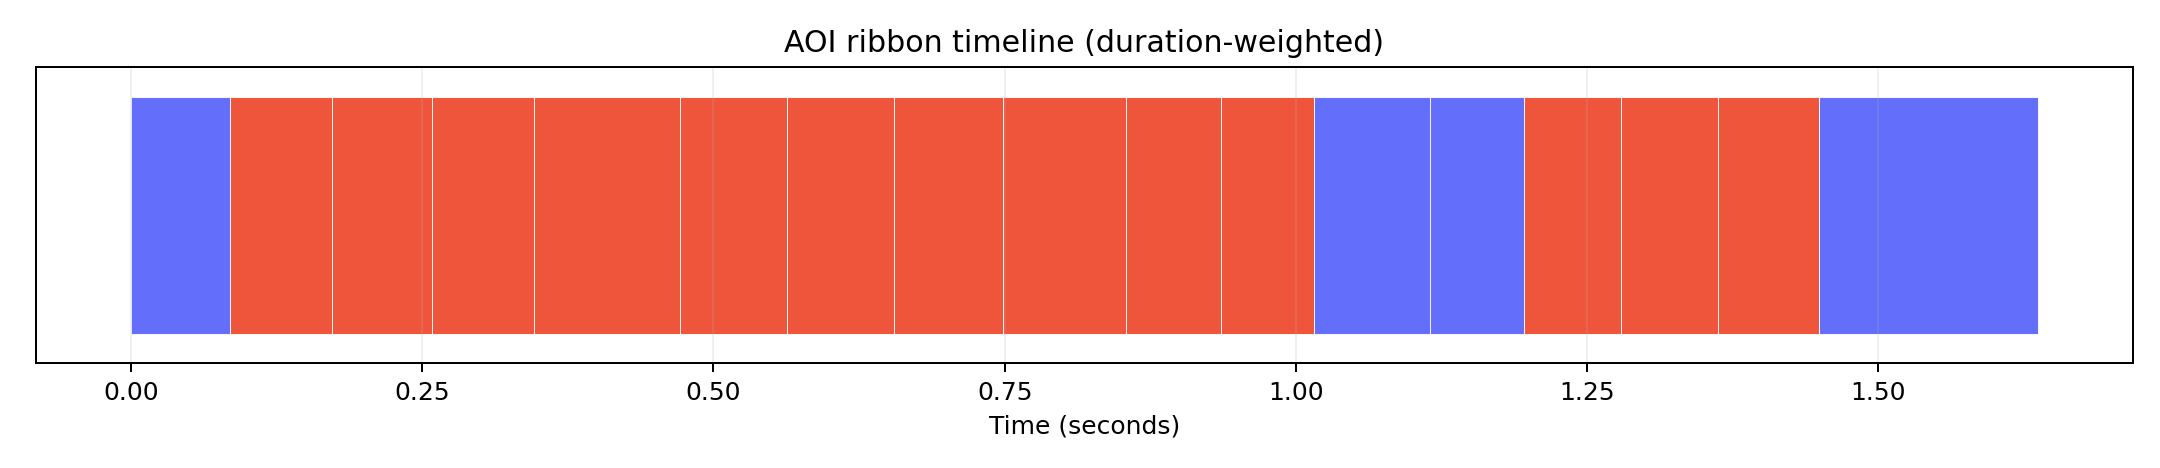
aoi_membership_ribbon.png-
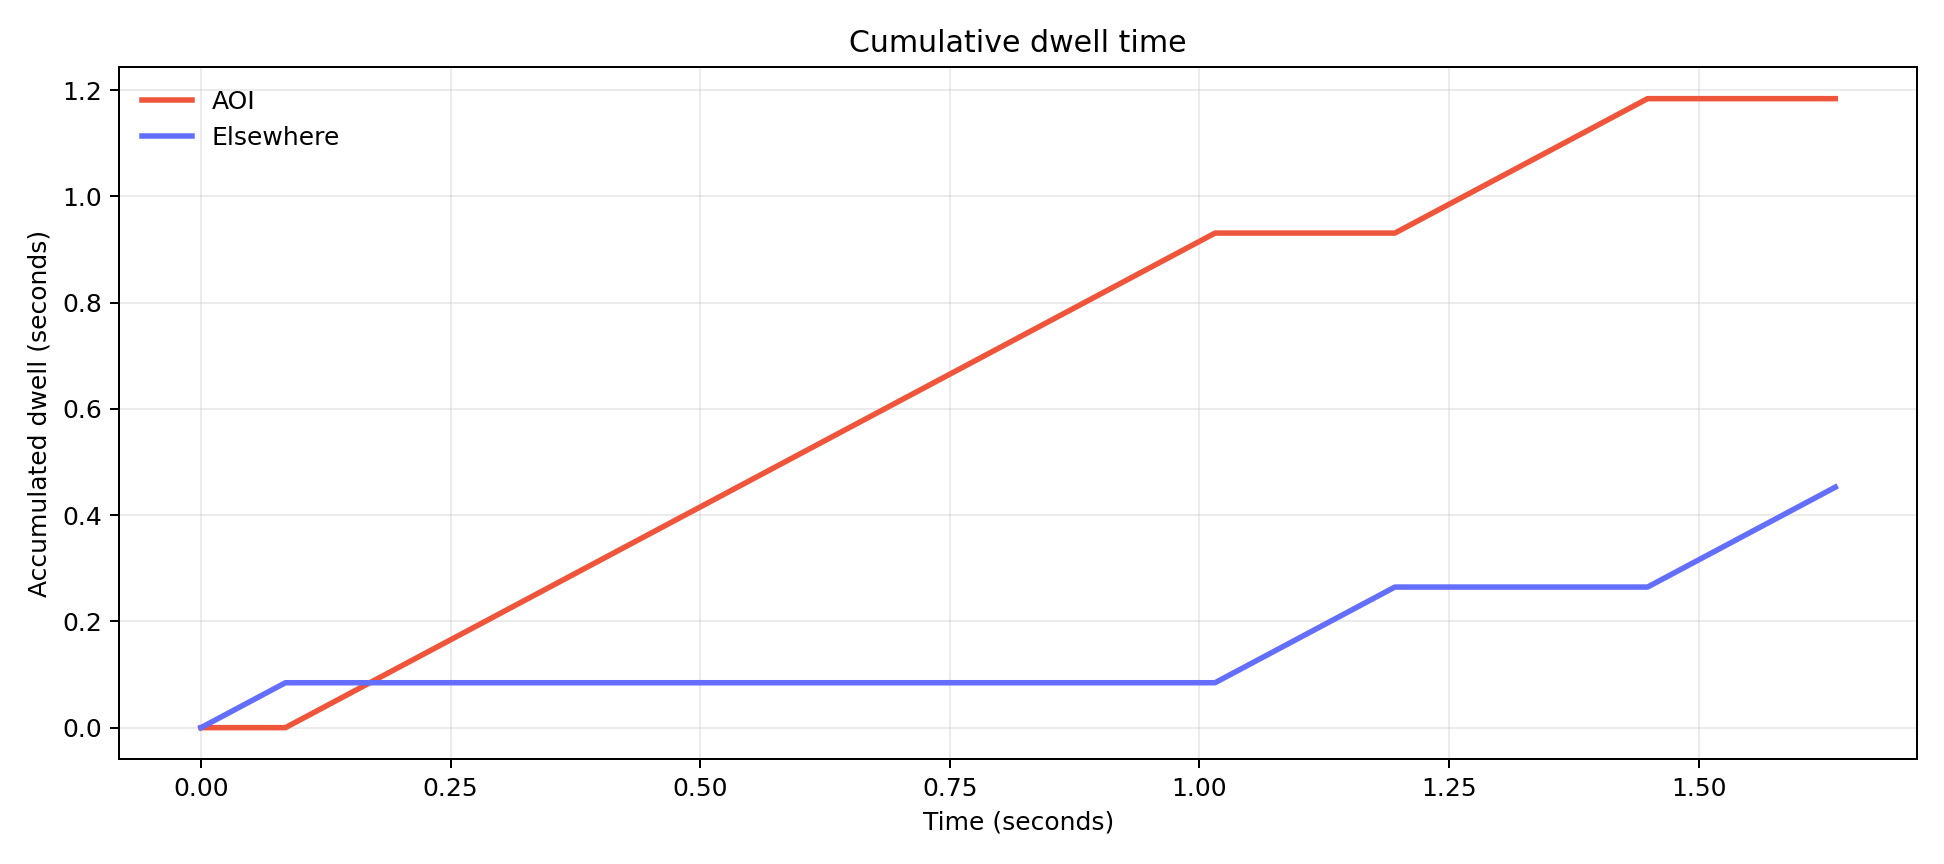
aoi_cumulative_dwell.png-
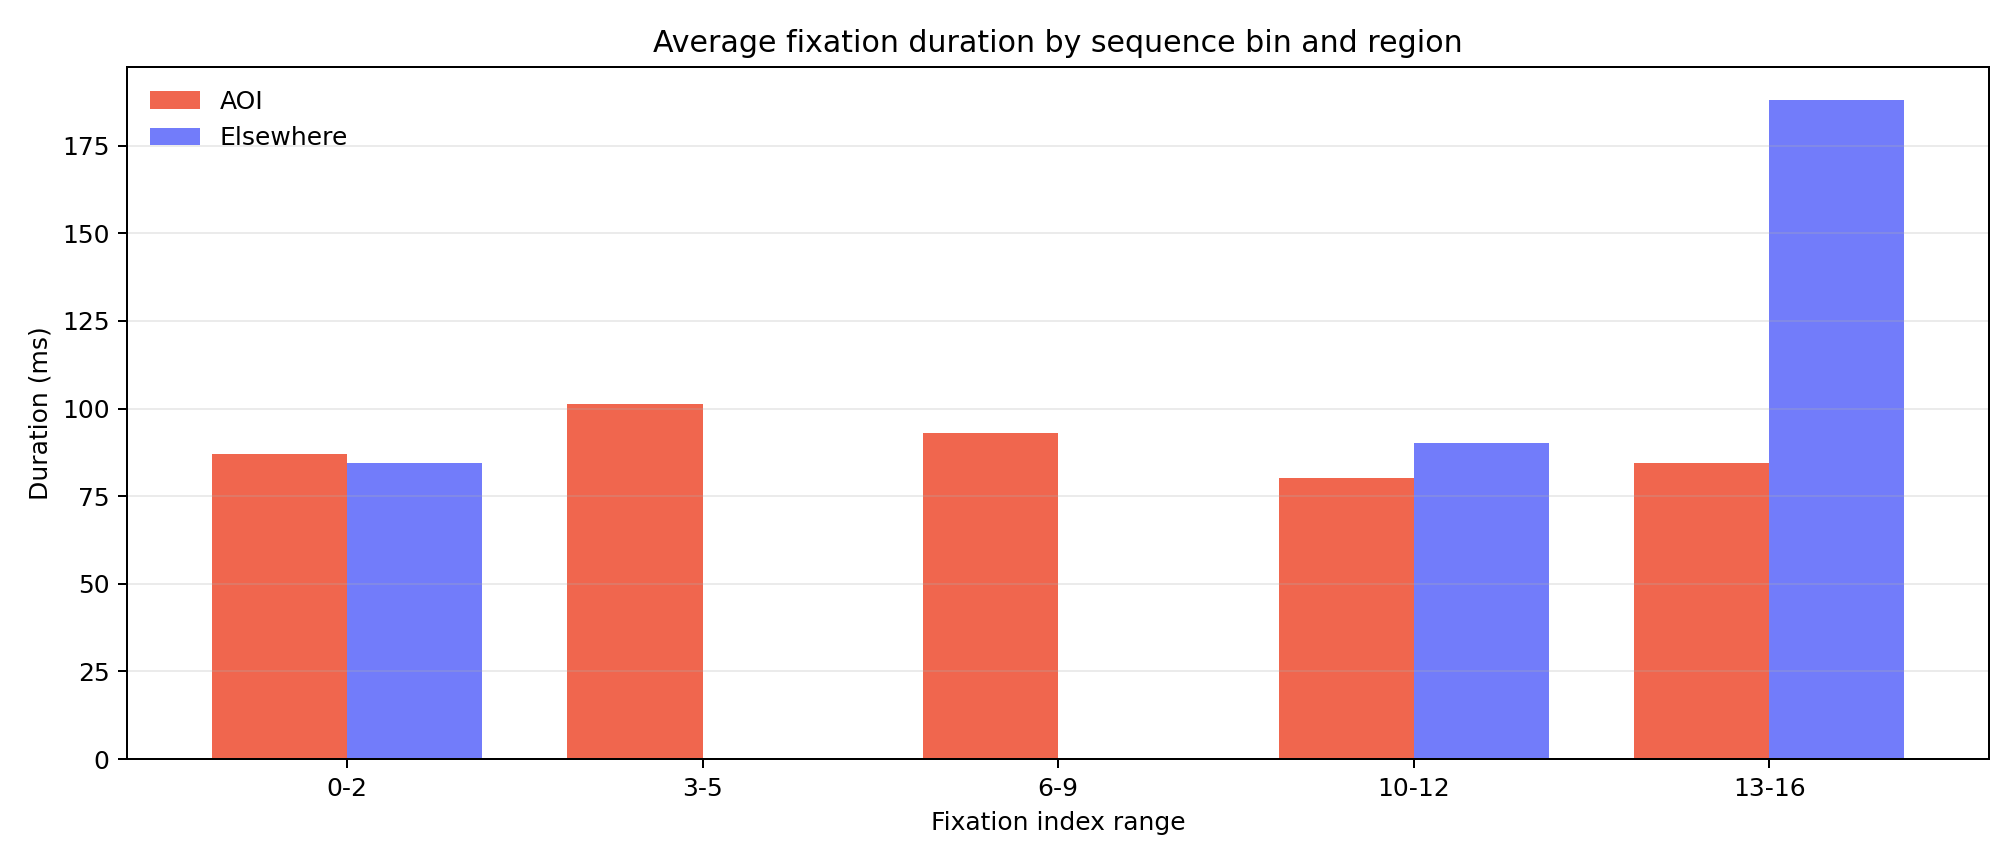
aoi_duration_strip.png
Step 5 Code
Use the script file
aoi_transitions_dwell.py. The script uses fixation timestamps, durations, and normalized fixation coordinates to compute AOI dwell and transition behavior.
"""
@author: Fjorda
"""
from __future__ import annotations
import argparse
from pathlib import Path
from typing import Tuple
import matplotlib.pyplot as plt
import numpy as np
import pandas as pd
# Default avatar AOI rectangle in panorama pixel space (original orientation)
IMG_W = 4096
IMG_H = 2048
AOI_X_LEFT = 2933
AOI_X_RIGHT = 3210
AOI_Y_TOP = 873
AOI_Y_BOTTOM = 1158
def parse_args():
script_dir = Path(__file__).resolve().parent
parser = argparse.ArgumentParser(
description="Analyze AOI dwell time and transitions from Pupil Labs fixations.csv."
)
parser.add_argument("--fixations", type=Path, default=script_dir / "fixations.csv", help="Path to fixations.csv")
parser.add_argument("--image", type=Path, default=None, help="Optional panorama image for overlay plots")
parser.add_argument("--out-dir", type=Path, default=script_dir / "outputs_tutorial4", help="Output directory")
parser.add_argument("--confidence-threshold", type=float, default=0.5, help="Minimum fixation confidence")
parser.add_argument("--max-fixations", type=int, default=200, help="Maximum number of fixations")
parser.add_argument("--img-width", type=int, default=IMG_W, help="Panorama width in pixels")
parser.add_argument("--img-height", type=int, default=IMG_H, help="Panorama height in pixels")
parser.add_argument("--aoi-left", type=float, default=AOI_X_LEFT, help="AOI left x in px")
parser.add_argument("--aoi-right", type=float, default=AOI_X_RIGHT, help="AOI right x in px")
parser.add_argument("--aoi-top", type=float, default=AOI_Y_TOP, help="AOI top y in px")
parser.add_argument("--aoi-bottom", type=float, default=AOI_Y_BOTTOM, help="AOI bottom y in px")
return parser.parse_args()
def load_fixations(path: Path, conf_thr: float, max_fixations: int) -> pd.DataFrame:
df = pd.read_csv(path)
required = {"start_timestamp", "duration", "norm_pos_x", "norm_pos_y"}
missing = required - set(df.columns)
if missing:
raise ValueError(f"Missing required columns in fixations.csv: {sorted(missing)}")
if "confidence" in df.columns:
df = df[df["confidence"] >= conf_thr].copy()
df = df.dropna(subset=["start_timestamp", "duration", "norm_pos_x", "norm_pos_y"]).copy()
df = df.sort_values("start_timestamp").reset_index(drop=True)
if max_fixations is not None and len(df) > max_fixations:
df = df.iloc[:max_fixations].copy()
return df
def fixations_to_pixels(df: pd.DataFrame, w: int, h: int) -> Tuple[np.ndarray, np.ndarray]:
x = np.clip(df["norm_pos_x"].to_numpy(dtype=float), 0.0, 1.0) * (w - 1)
y = (1.0 - np.clip(df["norm_pos_y"].to_numpy(dtype=float), 0.0, 1.0)) * (h - 1)
return x, y
def aoi_calibration_shift(df: pd.DataFrame, img_w: int, img_h: int, left: float, right: float, top: float, bottom: float) -> Tuple[float, float]:
norm_x = np.clip(df["norm_pos_x"].to_numpy(dtype=float), 0.0, 1.0)
norm_y_display = 1.0 - np.clip(df["norm_pos_y"].to_numpy(dtype=float), 0.0, 1.0)
aoi_center_x = ((left + right) / 2.0) / float(img_w)
aoi_center_y = 1.0 - ((top + bottom) / 2.0) / float(img_h)
return aoi_center_x - float(np.median(norm_x)), aoi_center_y - float(np.median(norm_y_display))
def classify_regions(x: np.ndarray, y: np.ndarray, left: float, right: float, top: float, bottom: float) -> np.ndarray:
in_aoi = (x >= left) & (x <= right) & (y >= top) & (y <= bottom)
return np.where(in_aoi, "AOI", "Elsewhere")
def transition_matrix(labels: np.ndarray) -> tuple[np.ndarray, list[str]]:
states = ["AOI", "Elsewhere"]
idx = {s: i for i, s in enumerate(states)}
M = np.zeros((2, 2), dtype=int)
for a, b in zip(labels[:-1], labels[1:]):
M[idx[a], idx[b]] += 1
return M, states
def transition_counts(labels: np.ndarray) -> dict[tuple[str, str], int]:
keys = [("AOI", "AOI"), ("AOI", "Elsewhere"), ("Elsewhere", "AOI"), ("Elsewhere", "Elsewhere")]
out = {k: 0 for k in keys}
for a, b in zip(labels[:-1], labels[1:]):
out[(a, b)] += 1
return out
def plot_membership_timeline(labels: np.ndarray, out_path: Path):
seq = (labels == "AOI").astype(int)
x = np.arange(len(seq))
fig, ax = plt.subplots(figsize=(12, 3.8))
ax.step(x, seq, where="post", linewidth=2.0)
ax.set_yticks([0, 1])
ax.set_yticklabels(["Elsewhere", "AOI"])
ax.set_xlabel("Fixation order")
ax.set_ylabel("Region")
ax.set_title("AOI membership timeline")
ax.grid(alpha=0.25)
fig.tight_layout()
fig.savefig(out_path, dpi=180)
plt.close(fig)
def plot_membership_ribbon(labels: np.ndarray, durations_ms: np.ndarray, out_path: Path):
fig, ax = plt.subplots(figsize=(12, 2.6))
durations_s = np.clip(durations_ms.astype(float) / 1000.0, 0.0, None)
starts = np.r_[0.0, np.cumsum(durations_s[:-1])]
colors = np.where(labels == "AOI", "#ef553b", "#636efa")
for s, d, c in zip(starts, durations_s, colors):
ax.broken_barh([(s, d)], (0.1, 0.8), facecolors=c, edgecolors="white", linewidth=0.35)
ax.set_ylim(0, 1)
ax.set_yticks([])
ax.set_xlabel("Time (seconds)")
ax.set_title("AOI ribbon timeline (duration-weighted)")
ax.grid(axis="x", alpha=0.2)
fig.tight_layout()
fig.savefig(out_path, dpi=180)
plt.close(fig)
def plot_dwell_time(labels: np.ndarray, durations_ms: np.ndarray, out_path: Path):
dwell_aoi = float(np.sum(durations_ms[labels == "AOI"]))
dwell_else = float(np.sum(durations_ms[labels == "Elsewhere"]))
vals_s = np.array([dwell_aoi, dwell_else], dtype=float) / 1000.0
fig, ax = plt.subplots(figsize=(7.2, 4.8))
bars = ax.bar(["AOI", "Elsewhere"], vals_s, color=["#ef553b", "#636efa"], alpha=0.95)
for b in bars:
h = b.get_height()
ax.text(b.get_x() + b.get_width() / 2.0, h, f"{h:.2f}s", ha="center", va="bottom", fontsize=10)
ax.set_title("Total dwell time by region")
ax.set_ylabel("Seconds")
ax.grid(axis="y", alpha=0.25)
fig.tight_layout()
fig.savefig(out_path, dpi=180)
plt.close(fig)
def plot_cumulative_dwell(labels: np.ndarray, durations_ms: np.ndarray, out_path: Path):
dur_s = durations_ms.astype(float) / 1000.0
t = np.r_[0.0, np.cumsum(dur_s)]
cum_aoi = np.r_[0.0, np.cumsum(np.where(labels == "AOI", dur_s, 0.0))]
cum_else = np.r_[0.0, np.cumsum(np.where(labels == "Elsewhere", dur_s, 0.0))]
fig, ax = plt.subplots(figsize=(10.8, 4.8))
ax.plot(t, cum_aoi, color="#ef553b", linewidth=2.2, label="AOI")
ax.plot(t, cum_else, color="#636efa", linewidth=2.2, label="Elsewhere")
ax.set_title("Cumulative dwell time")
ax.set_xlabel("Time (seconds)")
ax.set_ylabel("Accumulated dwell (seconds)")
ax.grid(alpha=0.25)
ax.legend(frameon=False)
fig.tight_layout()
fig.savefig(out_path, dpi=180)
plt.close(fig)
def plot_transition_matrix(M: np.ndarray, states: list[str], out_path: Path):
fig, ax = plt.subplots(figsize=(6.8, 5.6))
im = ax.imshow(M, cmap="Blues")
ax.set_xticks(range(len(states)))
ax.set_yticks(range(len(states)))
ax.set_xticklabels(states)
ax.set_yticklabels(states)
ax.set_xlabel("To")
ax.set_ylabel("From")
ax.set_title("AOI transition matrix")
for i in range(M.shape[0]):
for j in range(M.shape[1]):
ax.text(j, i, str(int(M[i, j])), ha="center", va="center", color="black")
fig.colorbar(im, ax=ax, fraction=0.046, pad=0.04)
fig.subplots_adjust(left=0.20, right=0.92, bottom=0.12, top=0.90)
fig.savefig(out_path, dpi=180, bbox_inches="tight", pad_inches=0.03)
plt.close(fig)
def plot_duration_strip(labels: np.ndarray, durations_ms: np.ndarray, out_path: Path):
# Bar chart: average fixation duration by sequence bins and region.
n = len(labels)
bins = min(6, max(3, n // 3 if n >= 9 else 3))
edges = np.linspace(0, n, bins + 1).astype(int)
centers = np.arange(bins, dtype=float)
aoi_means = np.full(bins, np.nan, dtype=float)
else_means = np.full(bins, np.nan, dtype=float)
dur = durations_ms.astype(float)
for i in range(bins):
lo, hi = edges[i], edges[i + 1]
if hi <= lo:
continue
lab = labels[lo:hi]
d = dur[lo:hi]
if np.any(lab == "AOI"):
aoi_means[i] = float(np.mean(d[lab == "AOI"]))
if np.any(lab == "Elsewhere"):
else_means[i] = float(np.mean(d[lab == "Elsewhere"]))
fig, ax = plt.subplots(figsize=(11.2, 4.8))
w = 0.38
x1 = centers - w / 2.0
x2 = centers + w / 2.0
# Replace NaN with 0 for plotting; keep legend and labels clear.
aoi_plot = np.nan_to_num(aoi_means, nan=0.0)
else_plot = np.nan_to_num(else_means, nan=0.0)
ax.bar(x1, aoi_plot, width=w, color="#ef553b", alpha=0.9, label="AOI")
ax.bar(x2, else_plot, width=w, color="#636efa", alpha=0.9, label="Elsewhere")
tick_labels = [f"{edges[i]}-{max(edges[i+1]-1, edges[i])}" for i in range(bins)]
ax.set_xticks(centers)
ax.set_xticklabels(tick_labels)
ax.set_title("Average fixation duration by sequence bin and region")
ax.set_xlabel("Fixation index range")
ax.set_ylabel("Duration (ms)")
ax.grid(axis="y", alpha=0.25)
ax.legend(frameon=False)
fig.tight_layout()
fig.savefig(out_path, dpi=180)
plt.close(fig)
def plot_sankey_like(transitions: dict[tuple[str, str], int], out_path: Path):
# Lightweight Sankey-style figure using thick curved links.
fig, ax = plt.subplots(figsize=(9.2, 5.8))
ax.set_xlim(0, 1)
ax.set_ylim(0, 1)
ax.axis("off")
# Node positions
xL, xR = 0.22, 0.78
yA, yE = 0.72, 0.28
node_w, node_h = 0.08, 0.14
ax.add_patch(plt.Rectangle((xL - node_w / 2, yA - node_h / 2), node_w, node_h, color="#ef553b", alpha=0.9))
ax.add_patch(plt.Rectangle((xL - node_w / 2, yE - node_h / 2), node_w, node_h, color="#636efa", alpha=0.9))
ax.add_patch(plt.Rectangle((xR - node_w / 2, yA - node_h / 2), node_w, node_h, color="#ef553b", alpha=0.9))
ax.add_patch(plt.Rectangle((xR - node_w / 2, yE - node_h / 2), node_w, node_h, color="#636efa", alpha=0.9))
ax.text(xL, 0.92, "From", ha="center", va="center", fontsize=11)
ax.text(xR, 0.92, "To", ha="center", va="center", fontsize=11)
ax.text(xL, yA, "AOI", ha="center", va="center", color="white", fontsize=10, fontweight="bold")
ax.text(xL, yE, "Elsewhere", ha="center", va="center", color="white", fontsize=10, fontweight="bold")
ax.text(xR, yA, "AOI", ha="center", va="center", color="white", fontsize=10, fontweight="bold")
ax.text(xR, yE, "Elsewhere", ha="center", va="center", color="white", fontsize=10, fontweight="bold")
vals = np.array(
[
transitions[("AOI", "AOI")],
transitions[("AOI", "Elsewhere")],
transitions[("Elsewhere", "AOI")],
transitions[("Elsewhere", "Elsewhere")],
],
dtype=float,
)
max_v = max(float(vals.max()), 1.0)
def link(y0: float, y1: float, value: float, color: str):
lw = 2.0 + 16.0 * (value / max_v)
ax.annotate(
"",
xy=(xR - node_w / 2, y1),
xytext=(xL + node_w / 2, y0),
arrowprops=dict(
arrowstyle="-",
linewidth=lw,
color=color,
alpha=0.42,
connectionstyle="arc3,rad=0.0",
),
)
ax.text(0.5, (y0 + y1) / 2.0 + (0.03 if y0 > y1 else -0.03), f"{int(value)}", ha="center", va="center", fontsize=9)
link(yA, yA, transitions[("AOI", "AOI")], "#ef553b")
link(yA, yE, transitions[("AOI", "Elsewhere")], "#a855f7")
link(yE, yA, transitions[("Elsewhere", "AOI")], "#10b981")
link(yE, yE, transitions[("Elsewhere", "Elsewhere")], "#636efa")
ax.set_title("Sankey-style AOI transitions", pad=12)
fig.tight_layout()
fig.savefig(out_path, dpi=180)
plt.close(fig)
def plot_transition_network(transitions: dict[tuple[str, str], int], out_path: Path):
fig, ax = plt.subplots(figsize=(7.2, 5.8))
ax.set_xlim(0, 1)
ax.set_ylim(0, 1)
ax.axis("off")
pos = {"AOI": (0.3, 0.5), "Elsewhere": (0.7, 0.5)}
node_color = {"AOI": "#ef553b", "Elsewhere": "#636efa"}
for n, (x, y) in pos.items():
circ = plt.Circle((x, y), 0.095, color=node_color[n], alpha=0.92)
ax.add_patch(circ)
ax.text(x, y, n, ha="center", va="center", color="white", fontweight="bold")
max_v = max(float(max(transitions.values())), 1.0)
pairs = [("AOI", "AOI"), ("AOI", "Elsewhere"), ("Elsewhere", "AOI"), ("Elsewhere", "Elsewhere")]
for a, b in pairs:
v = float(transitions[(a, b)])
lw = 1.5 + 10.0 * (v / max_v)
if a == b:
x, y = pos[a]
loop = plt.Circle((x, y + 0.17), 0.06, fill=False, linewidth=lw, color="#94a3b8", alpha=0.7)
ax.add_patch(loop)
ax.text(x, y + 0.27, f"{int(v)}", ha="center", va="center", fontsize=9)
else:
xa, ya = pos[a]
xb, yb = pos[b]
rad = 0.2 if a == "AOI" else -0.2
ax.annotate(
"",
xy=(xb, yb),
xytext=(xa, ya),
arrowprops=dict(arrowstyle="->", linewidth=lw, color="#475569", alpha=0.75, connectionstyle=f"arc3,rad={rad}"),
)
ax.text(0.5, 0.63 if a == "AOI" else 0.37, f"{int(v)}", ha="center", va="center", fontsize=9)
ax.set_title("Transition network graph")
fig.tight_layout()
fig.savefig(out_path, dpi=180)
plt.close(fig)
def draw_aoi_rect(ax, left: float, right: float, top: float, bottom: float):
ax.add_patch(
plt.Rectangle(
(left, top),
right - left,
bottom - top,
fill=False,
edgecolor="white",
linewidth=2.2,
linestyle="--",
)
)
def main():
args = parse_args()
fix_path = args.fixations.expanduser().resolve()
out_dir = args.out_dir.expanduser().resolve()
out_dir.mkdir(parents=True, exist_ok=True)
if not fix_path.exists():
raise FileNotFoundError(f"Missing fixations file: {fix_path}")
df = load_fixations(fix_path, args.confidence_threshold, args.max_fixations)
left = min(args.aoi_left, args.aoi_right)
right = max(args.aoi_left, args.aoi_right)
top = min(args.aoi_top, args.aoi_bottom)
bottom = max(args.aoi_top, args.aoi_bottom)
shift_x, shift_y = aoi_calibration_shift(df, args.img_width, args.img_height, left, right, top, bottom)
x, y = fixations_to_pixels(df, args.img_width, args.img_height)
x = np.clip(x + shift_x * (args.img_width - 1), 0.0, args.img_width - 1)
y = np.clip(y + shift_y * (args.img_height - 1), 0.0, args.img_height - 1)
labels = classify_regions(
x=x,
y=y,
left=left,
right=right,
top=top,
bottom=bottom,
)
M, states = transition_matrix(labels)
transitions = transition_counts(labels)
durations_ms = df["duration"].to_numpy(dtype=float)
plot_membership_timeline(labels, out_dir / "aoi_membership_timeline.png")
plot_membership_ribbon(labels, durations_ms, out_dir / "aoi_membership_ribbon.png")
plot_dwell_time(labels, durations_ms, out_dir / "aoi_dwell_time.png")
plot_cumulative_dwell(labels, durations_ms, out_dir / "aoi_cumulative_dwell.png")
plot_transition_matrix(M, states, out_dir / "aoi_transition_matrix.png")
plot_duration_strip(labels, durations_ms, out_dir / "aoi_duration_strip.png")
# Sankey-style output intentionally omitted for this tutorial version.
# We intentionally skip panorama fixation map here because this visualization
# is already covered in previous tutorials.
print(f"Fixations used: {len(df):,}")
print(f"AOI fixations: {int(np.sum(labels == 'AOI')):,}")
print(f"Outputs saved to: {out_dir}")
if __name__ == "__main__":
main()
After you run the script, you will obtain the AOI transition and dwell outputs listed in Step 4. Example figures below keep the same image paths format used on this site (replace with your final Tutorial 4 assets when uploading).