
Blink Timing vs Repeated Stimulus Cycles in Python (Pupil Labs)
This guide shows how to match blink events to repeated stimulus ON/OFF windows using Pupil Labs exports.
By the end, you will generate:
- A figure (
- Event-level table (
- Summary table (
Note. This workflow uses
Download blinks.csv
Download gaze_positions.csv
Download blink summary table
By the end, you will generate:
- A figure (
blink_stimulus_cycle_analysis.png) with session timeline + within-cycle blink profile
- Event-level table (
blink_event_locked_trials.csv)
- Summary table (
blink_stimulus_cycle_summary.csv)
Note. This workflow uses
blinks.csv and gaze_positions.csv. Blink timestamps are aligned to repeated stimulus cycles using recording start time from gaze timestamps.
Download blinks.csv
Download gaze_positions.csv
Download blink summary table
Requirements
- Anaconda Python Development Environment
-
-
- Python packages:
-
-
-
-
blinks.csv exported from Pupil Labs-
gaze_positions.csv exported from Pupil Labs- Python packages:
-
pandas-
numpy-
matplotlib
Setup
1. Install Anaconda if needed.
2. Open Spyder, Jupyter Notebook, or VS Code.
3. Put
4. Save the script in the same folder (or a folder of your choice and pass paths on the command line).
To use Spyder, install Anaconda, run it, and launch Spyder. If you see Install instead of Launch for Spyder, install Spyder first. Create a new file in Spyder and save it in the same directory as your data when you run the examples below.
2. Open Spyder, Jupyter Notebook, or VS Code.
3. Put
blinks.csv and gaze_positions.csv in your working folder (or pass explicit paths).4. Save the script in the same folder (or a folder of your choice and pass paths on the command line).
To use Spyder, install Anaconda, run it, and launch Spyder. If you see Install instead of Launch for Spyder, install Spyder first. Create a new file in Spyder and save it in the same directory as your data when you run the examples below.
Step 1 Data
We start with blink and gaze exports from Pupil Labs.
Important variables from
-
- optional:
- optional:
Important variable from
-
Important variables from
blinks.csv: -
start_timestamp, duration (blink timing)- optional:
end_timestamp (if missing, computed from start + duration)- optional:
confidence (filter with --confidence-threshold)Important variable from
gaze_positions.csv:-
gaze_timestamp (used to anchor recording start for cycle alignment)Step 2 Match blinks to repeated ON/OFF cycles
In this step, you:
1. Load
2. Load
3. Define repeated cycles using trial duration and stimulus-on duration
4. Classify each blink as occurring during stimulus ON or OFF
5. Build a within-cycle blink-rate profile with histogram bins
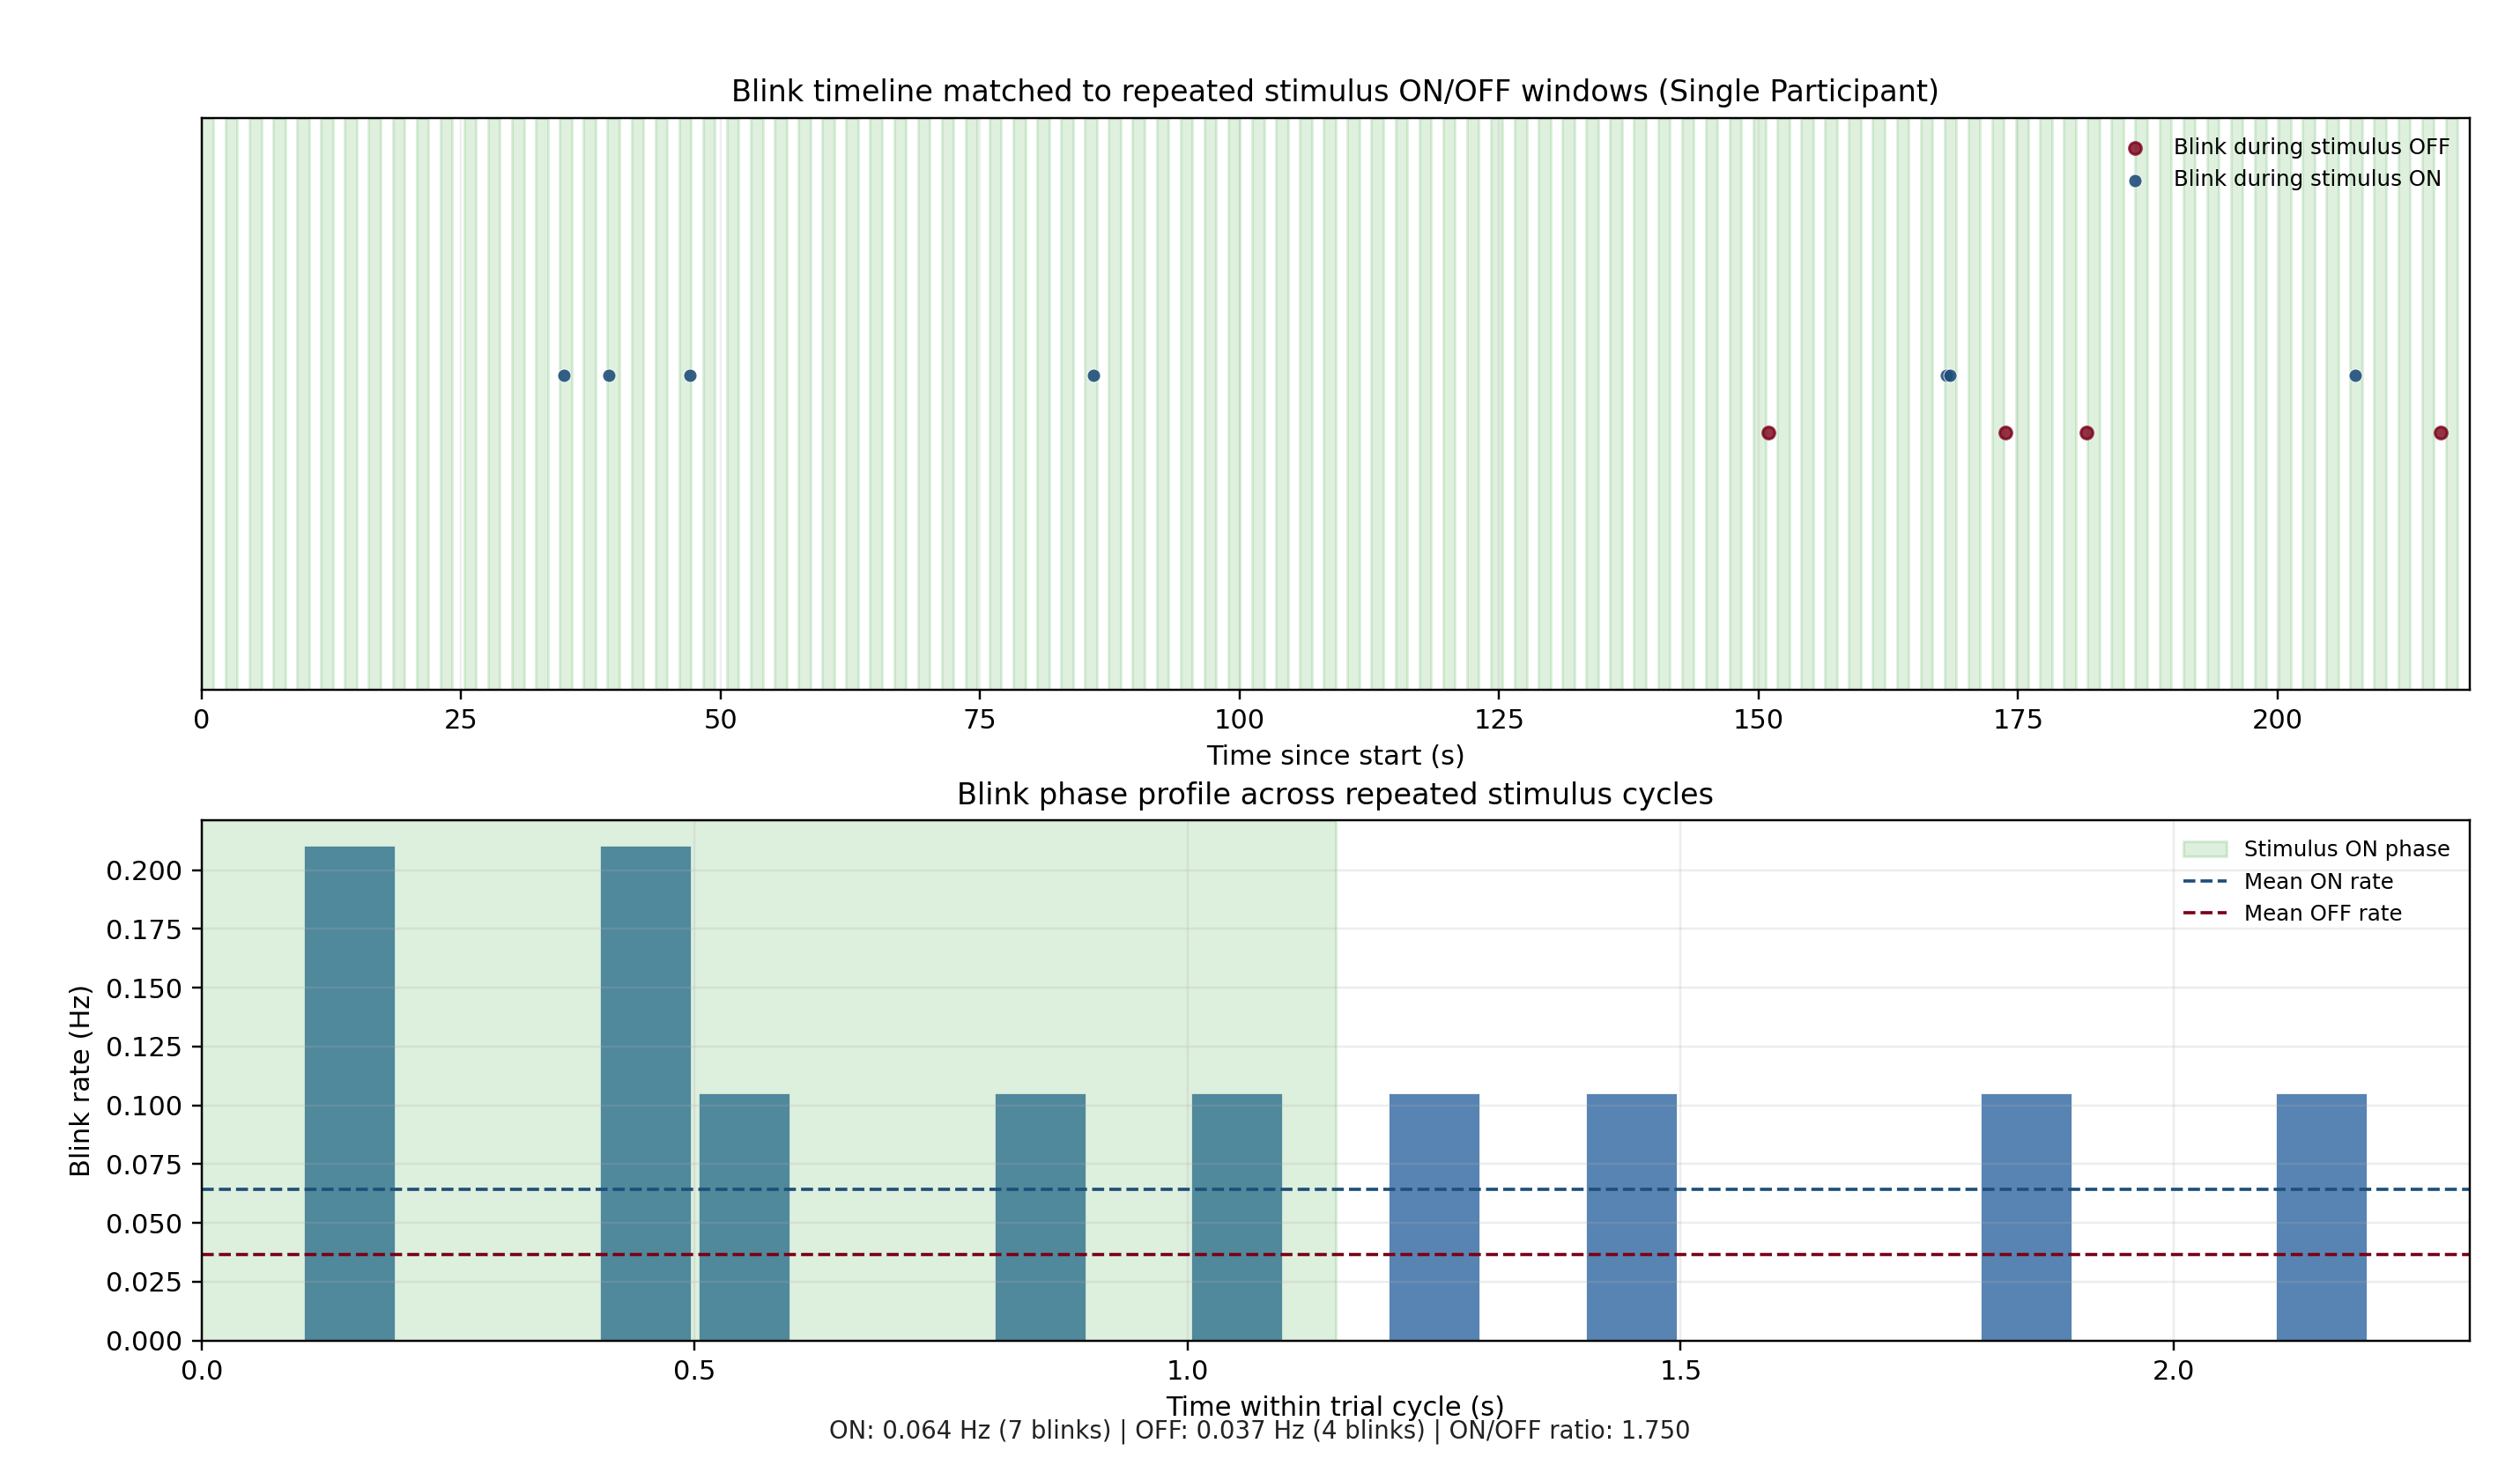
The top panel shows session time with repeated ON windows. The bottom panel summarizes where blinks tend to happen inside one cycle.
1. Load
blinks.csv and filter low-confidence events2. Load
gaze_positions.csv and get recording start timestamp3. Define repeated cycles using trial duration and stimulus-on duration
4. Classify each blink as occurring during stimulus ON or OFF
5. Build a within-cycle blink-rate profile with histogram bins
The top panel shows session time with repeated ON windows. The bottom panel summarizes where blinks tend to happen inside one cycle.
Step 3 Generate outputs
1. Write
2. Write
3. Write
Outputs are saved to your
blink_stimulus_cycle_analysis.png (analysis figure)2. Write
blink_event_locked_trials.csv (blink-level cycle labels)3. Write
blink_stimulus_cycle_summary.csv (ON/OFF counts, rates, and ratio)Outputs are saved to your
outputs folder by default.
Step 4 Run the Script
Put
blinks.csv and gaze_positions.csv in the same folder as the script and run the code Step 5 Code
Use the script file below. It aligns blink timestamps to repeated stimulus cycles, labels each blink as ON/OFF, and renders timeline and cycle-profile plots.
"""
@author: Fjorda
"""
from __future__ import annotations
import argparse
from pathlib import Path
import matplotlib.pyplot as plt
import numpy as np
import pandas as pd
SCRIPT_DIR = Path(__file__).resolve().parent
DEFAULT_OUT = SCRIPT_DIR / "outputs_tutorial8"
DEFAULT_BLINKS = SCRIPT_DIR / "blinks.csv"
DEFAULT_GAZE = SCRIPT_DIR / "gaze_positions.csv"
def parse_args() -> argparse.Namespace:
parser = argparse.ArgumentParser(
description="Tutorial 8: blink timing analysis across repeated stimulus cycles"
)
parser.add_argument("--blinks", type=Path, default=DEFAULT_BLINKS, help="Path to blinks.csv")
parser.add_argument("--gaze", type=Path, default=DEFAULT_GAZE, help="Path to gaze_positions.csv")
parser.add_argument("--out-dir", type=Path, default=DEFAULT_OUT)
parser.add_argument("--label", type=str, default="Single Participant")
parser.add_argument("--confidence-threshold", type=float, default=0.6)
parser.add_argument("--trial-duration-sec", type=float, default=2.3)
parser.add_argument("--stimulus-duration-sec", type=float, default=1.15)
parser.add_argument("--n-trials", type=int, default=50)
parser.add_argument("--bin-sec", type=float, default=0.1, help="Phase histogram bin width in seconds")
parser.add_argument(
"--recording-start-ts",
type=float,
default=None,
help="Optional absolute recording start timestamp. If omitted, first blink timestamp is used as t=0.",
)
return parser.parse_args()
def _resolve_blinks_path(args: argparse.Namespace) -> Path:
p = args.blinks.expanduser().resolve()
if not p.is_file():
raise FileNotFoundError(f"Blinks file not found: {p}")
return p
def _resolve_gaze_path(args: argparse.Namespace) -> Path:
p = args.gaze.expanduser().resolve()
if not p.is_file():
raise FileNotFoundError(f"Gaze file not found: {p}")
return p
def _load_recording_start_from_gaze(gaze_path: Path) -> float:
g = pd.read_csv(gaze_path)
if "gaze_timestamp" not in g.columns:
raise ValueError(f"Missing gaze_timestamp column in {gaze_path}")
ts = pd.to_numeric(g["gaze_timestamp"], errors="coerce").dropna()
if len(ts) == 0:
raise ValueError(f"No valid gaze_timestamp values in {gaze_path}")
return float(ts.min())
def load_blinks(path: Path, conf_thr: float) -> pd.DataFrame:
df = pd.read_csv(path)
required = {"start_timestamp", "duration"}
missing = required - set(df.columns)
if missing:
raise ValueError(f"Missing blink columns: {sorted(missing)}")
if "confidence" in df.columns:
df = df[df["confidence"] >= conf_thr].copy()
df = df.dropna(subset=["start_timestamp", "duration"]).copy()
df["start_timestamp"] = pd.to_numeric(df["start_timestamp"], errors="coerce")
df["duration"] = pd.to_numeric(df["duration"], errors="coerce")
df = df.dropna(subset=["start_timestamp", "duration"]).copy()
# If duration looks like milliseconds, convert to seconds.
if len(df) and float(np.nanmedian(df["duration"].to_numpy(dtype=float))) > 10.0:
df["duration"] = df["duration"] / 1000.0
if "end_timestamp" in df.columns:
df["end_timestamp"] = pd.to_numeric(df["end_timestamp"], errors="coerce")
else:
df["end_timestamp"] = df["start_timestamp"] + df["duration"]
df["end_timestamp"] = df["end_timestamp"].fillna(df["start_timestamp"] + df["duration"])
df = df[df["duration"] > 0].copy()
df = df.sort_values("start_timestamp").reset_index(drop=True)
return df
def build_cycle_matched_table(
blinks: pd.DataFrame,
trial_duration_sec: float,
stimulus_duration_sec: float,
n_trials: int,
recording_start_ts: float | None,
) -> tuple[pd.DataFrame, np.ndarray, np.ndarray]:
starts_abs = blinks["start_timestamp"].to_numpy(dtype=float)
t0 = float(recording_start_ts) if recording_start_ts is not None else float(starts_abs[0])
starts_rel = starts_abs - t0
starts_rel = starts_rel[starts_rel >= 0.0]
if len(starts_rel) == 0:
raise ValueError("No blink timestamps at or after recording start.")
session_end_s = max(float(np.max(starts_rel)), max(n_trials, 1) * trial_duration_sec)
onset_times = np.arange(0.0, session_end_s + trial_duration_sec, trial_duration_sec, dtype=float)
if len(onset_times) == 0:
raise ValueError("No onset times generated; check trial settings.")
phase = np.mod(starts_rel, trial_duration_sec)
stim_on = phase < min(stimulus_duration_sec, trial_duration_sec)
trial_idx = np.floor(starts_rel / trial_duration_sec).astype(int) + 1
tbl = pd.DataFrame(
{
"blink_time_s": starts_rel,
"trial_index": trial_idx,
"phase_in_trial_s": phase,
"is_stimulus_on": stim_on.astype(int),
}
)
return tbl, starts_rel, onset_times
def make_plot(
tbl: pd.DataFrame,
onset_times: np.ndarray,
trial_duration_sec: float,
stim_dur: float,
bin_sec: float,
out_png: Path,
label: str,
) -> dict[str, float]:
t = tbl["blink_time_s"].to_numpy(dtype=float)
phase = tbl["phase_in_trial_s"].to_numpy(dtype=float)
on_mask = tbl["is_stimulus_on"].to_numpy(dtype=int) == 1
off_mask = ~on_mask
session_end = float(max(np.max(t), onset_times[-1] + trial_duration_sec))
n_trials = int(np.floor(session_end / trial_duration_sec))
total_on_s = n_trials * min(stim_dur, trial_duration_sec)
total_off_s = n_trials * max(trial_duration_sec - min(stim_dur, trial_duration_sec), 1e-9)
n_on = int(np.sum(on_mask))
n_off = int(np.sum(off_mask))
on_rate_hz = float(n_on / max(total_on_s, 1e-9))
off_rate_hz = float(n_off / max(total_off_s, 1e-9))
on_off_ratio = float(on_rate_hz / off_rate_hz) if off_rate_hz > 0 else float("nan")
edges = np.arange(0.0, trial_duration_sec + bin_sec, bin_sec, dtype=float)
if len(edges) < 2:
raise ValueError("Invalid phase bins. Reduce --bin-sec or increase trial duration.")
counts, _ = np.histogram(phase, bins=edges)
centers = (edges[:-1] + edges[1:]) / 2.0
phase_rate_hz = counts.astype(float) / max(n_trials * bin_sec, 1e-9)
fig = plt.figure(figsize=(13, 7.6))
gs = fig.add_gridspec(2, 1, height_ratios=[1.1, 1.0], hspace=0.24)
ax_timeline = fig.add_subplot(gs[0, 0])
ax_phase = fig.add_subplot(gs[1, 0])
fig.subplots_adjust(left=0.08, right=0.98, bottom=0.09, top=0.92)
# Absolute timeline with repeated stimulus ON windows.
max_trials_to_draw = int(np.ceil(session_end / trial_duration_sec))
for j in range(max_trials_to_draw):
s0 = j * trial_duration_sec
s1 = s0 + min(stim_dur, trial_duration_sec)
if s0 > session_end:
break
ax_timeline.axvspan(s0, min(s1, session_end), color="#2ca02c", alpha=0.15)
if len(tbl):
ax_timeline.scatter(
t[off_mask],
np.full(np.sum(off_mask), 0.45),
s=20,
c="#7a0018",
alpha=0.8,
label="Blink during stimulus OFF",
)
ax_timeline.scatter(
t[on_mask],
np.full(np.sum(on_mask), 0.55),
s=24,
c="#1f4e79",
alpha=0.9,
edgecolors="white",
linewidths=0.3,
label="Blink during stimulus ON",
)
ax_timeline.set_xlim(0.0, session_end)
ax_timeline.set_ylim(0.0, 1.0)
ax_timeline.set_yticks([])
ax_timeline.set_xlabel("Time since start (s)")
ax_timeline.set_title(f"Blink timeline matched to repeated stimulus ON/OFF windows ({label})", fontsize=11)
ax_timeline.grid(axis="x", alpha=0.2)
ax_timeline.legend(loc="upper right", frameon=False, fontsize=8)
# Within-trial phase profile: where blinks occur inside each 2.3 s cycle.
ax_phase.bar(centers, phase_rate_hz, width=bin_sec * 0.92, color="#3a6ea5", alpha=0.85, edgecolor="white", linewidth=0.3)
ax_phase.axvspan(0.0, min(stim_dur, trial_duration_sec), color="#2ca02c", alpha=0.16, label="Stimulus ON phase")
ax_phase.axhline(on_rate_hz, color="#1f4e79", linestyle="--", linewidth=1.2, label="Mean ON rate")
ax_phase.axhline(off_rate_hz, color="#7a0018", linestyle="--", linewidth=1.2, label="Mean OFF rate")
ax_phase.set_xlim(0.0, trial_duration_sec)
ax_phase.set_xlabel("Time within trial cycle (s)")
ax_phase.set_ylabel("Blink rate (Hz)")
ax_phase.set_title("Blink phase profile across repeated stimulus cycles", fontsize=11)
ax_phase.grid(alpha=0.22)
ax_phase.legend(loc="upper right", frameon=False, fontsize=8)
summary_text = f"ON: {on_rate_hz:.3f} Hz ({n_on} blinks) | OFF: {off_rate_hz:.3f} Hz ({n_off} blinks) | ON/OFF ratio: {on_off_ratio:.3f}"
fig.text(0.5, 0.02, summary_text, ha="center", va="bottom", fontsize=9, color="#222222")
fig.savefig(out_png, dpi=220)
plt.close(fig)
return {
"n_trials": int(n_trials),
"n_event_locked_blinks": int(len(t)),
"blink_count_stimulus_on": n_on,
"blink_count_stimulus_off": n_off,
"blink_rate_stimulus_on_hz": on_rate_hz,
"blink_rate_stimulus_off_hz": off_rate_hz,
"blink_rate_on_off_ratio": on_off_ratio,
}
def main() -> None:
args = parse_args()
blinks_path = _resolve_blinks_path(args)
gaze_path = _resolve_gaze_path(args)
out_dir = args.out_dir.expanduser().resolve()
out_dir.mkdir(parents=True, exist_ok=True)
blinks = load_blinks(blinks_path, conf_thr=args.confidence_threshold)
if len(blinks) == 0:
raise ValueError(
"No blink events after filtering at the chosen confidence threshold. "
"Pick a participant with enough high-confidence blinks or lower --confidence-threshold."
)
recording_start_ts = (
float(args.recording_start_ts)
if args.recording_start_ts is not None
else _load_recording_start_from_gaze(gaze_path)
)
tbl, starts_rel, onset_times = build_cycle_matched_table(
blinks=blinks,
trial_duration_sec=args.trial_duration_sec,
stimulus_duration_sec=args.stimulus_duration_sec,
n_trials=args.n_trials,
recording_start_ts=recording_start_ts,
)
summary = make_plot(
tbl=tbl,
onset_times=onset_times,
trial_duration_sec=args.trial_duration_sec,
stim_dur=args.stimulus_duration_sec,
bin_sec=args.bin_sec,
out_png=out_dir / "blink_stimulus_cycle_analysis.png",
label=args.label,
)
summary.update(
{
"blinks_file": str(blinks_path),
"gaze_file": str(gaze_path),
"n_total_blinks_session": int(len(starts_rel)),
"trial_duration_sec": float(args.trial_duration_sec),
"stimulus_duration_sec": float(args.stimulus_duration_sec),
"recording_start_ts_used": recording_start_ts,
"bin_sec": float(args.bin_sec),
}
)
tbl.to_csv(out_dir / "blink_event_locked_trials.csv", index=False)
pd.DataFrame([summary]).to_csv(out_dir / "blink_stimulus_cycle_summary.csv", index=False)
print(f"Outputs saved to: {out_dir}")
print(f"Blinks used: {blinks_path}")
print(f"Gaze used for start timestamp: {gaze_path}")
if __name__ == "__main__":
main()
After you run the script, you will obtain the outputs listed in Step 3. The preview below uses the same asset path as on this site.
Conclusions
- Cycle-matched blink labels make it straightforward to compare blink timing during stimulus ON vs OFF periods.
- The session timeline helps verify blink alignment against repeated stimulus windows.
- The cycle profile summarizes where blink activity concentrates within each repeated trial interval.