From Raw Gaze to Fixations in Python using Pupil Labs Eye Tracker
This guide explains how to transform noisy raw gaze samples into meaningful eye movement events (blinks, saccades, and fixations) using data exported from a Pupil Labs eye tracker.
You will produce three informative plots:
- Raw gaze positions over time (
- Gaze velocity over time with threshold
- Detected fixation intervals over time
Note: this workflow is designed for Pupil Labs CSV exports (
You will produce three informative plots:
- Raw gaze positions over time (
"norm_pos_x", "norm_pos_y")
- Gaze velocity over time with threshold
- Detected fixation intervals over time
Note: this workflow is designed for Pupil Labs CSV exports (
"gaze_positions", "fixations", "blinks").
Requirements
-Anconda Python Development Environment
-CSV files exported from Pupil Lab
-Python packages:
- pandas
- numpy
- matplotlib
-CSV files exported from Pupil Lab
-Python packages:
- pandas
- numpy
- matplotlib
Setup
To have access to spyder it is recommended to download first Anaconda.
After the download has been completed, you can run Anaconda and lunch Spyder. If the launch button does not show but an Install button shows instead, make sure to install Spyder and then run it.
After you open Spyder, you can create a new file and save the file in the same directory where your data is located. Now we are ready to start coding.
Step 1 Data
Let's assume that we have pupil labs eye tracker and we collected a large volume of data from users eyes.
Important variables from `gaze_positions.csv`:
-
-
-
Download Gaze Positions CSV File
Important variables from `fixations.csv`:
-
-
-
Download Fixations CSV File
Important variables from `blinks.csv`:
-
-
Download Blinks CSV File
Important variables from `gaze_positions.csv`:
-
"gaze_timestamp": continuous timestamp -
"norm_pos_x", "norm_pos_y": normalized screen/world gaze coordinates -
"confidence": gaze confidence value from Pupil Labs Download Gaze Positions CSV File
Important variables from `fixations.csv`:
-
"start_timestamp"-
"duration" (milliseconds)-
"end_timestamp" Download Fixations CSV File
Important variables from `blinks.csv`:
-
"start_timestamp"-
"end_timestamp"Download Blinks CSV File
Step 2 Clean, Prepare the Signals, Mark Blinks and Saccades and Visualize Raw Gaze, Velocity, and Fixations
In this python code we:
- load gaze samples
- remove low-confidence points
- sort by timestamp
- compute sample-to-sample velocity from normalized coordinates
Velocity is computed as:
- distance between consecutive gaze points divided by time difference
This gives a direct measure of fast eye movement bursts (likely saccades) versus slower stable periods (likely fixations).
Next, we overlay blink intervals from
- robust threshold =
This is practical for classroom teaching because:
- easy to explain
- robust to outliers
- adapts to each recording
We then generate:
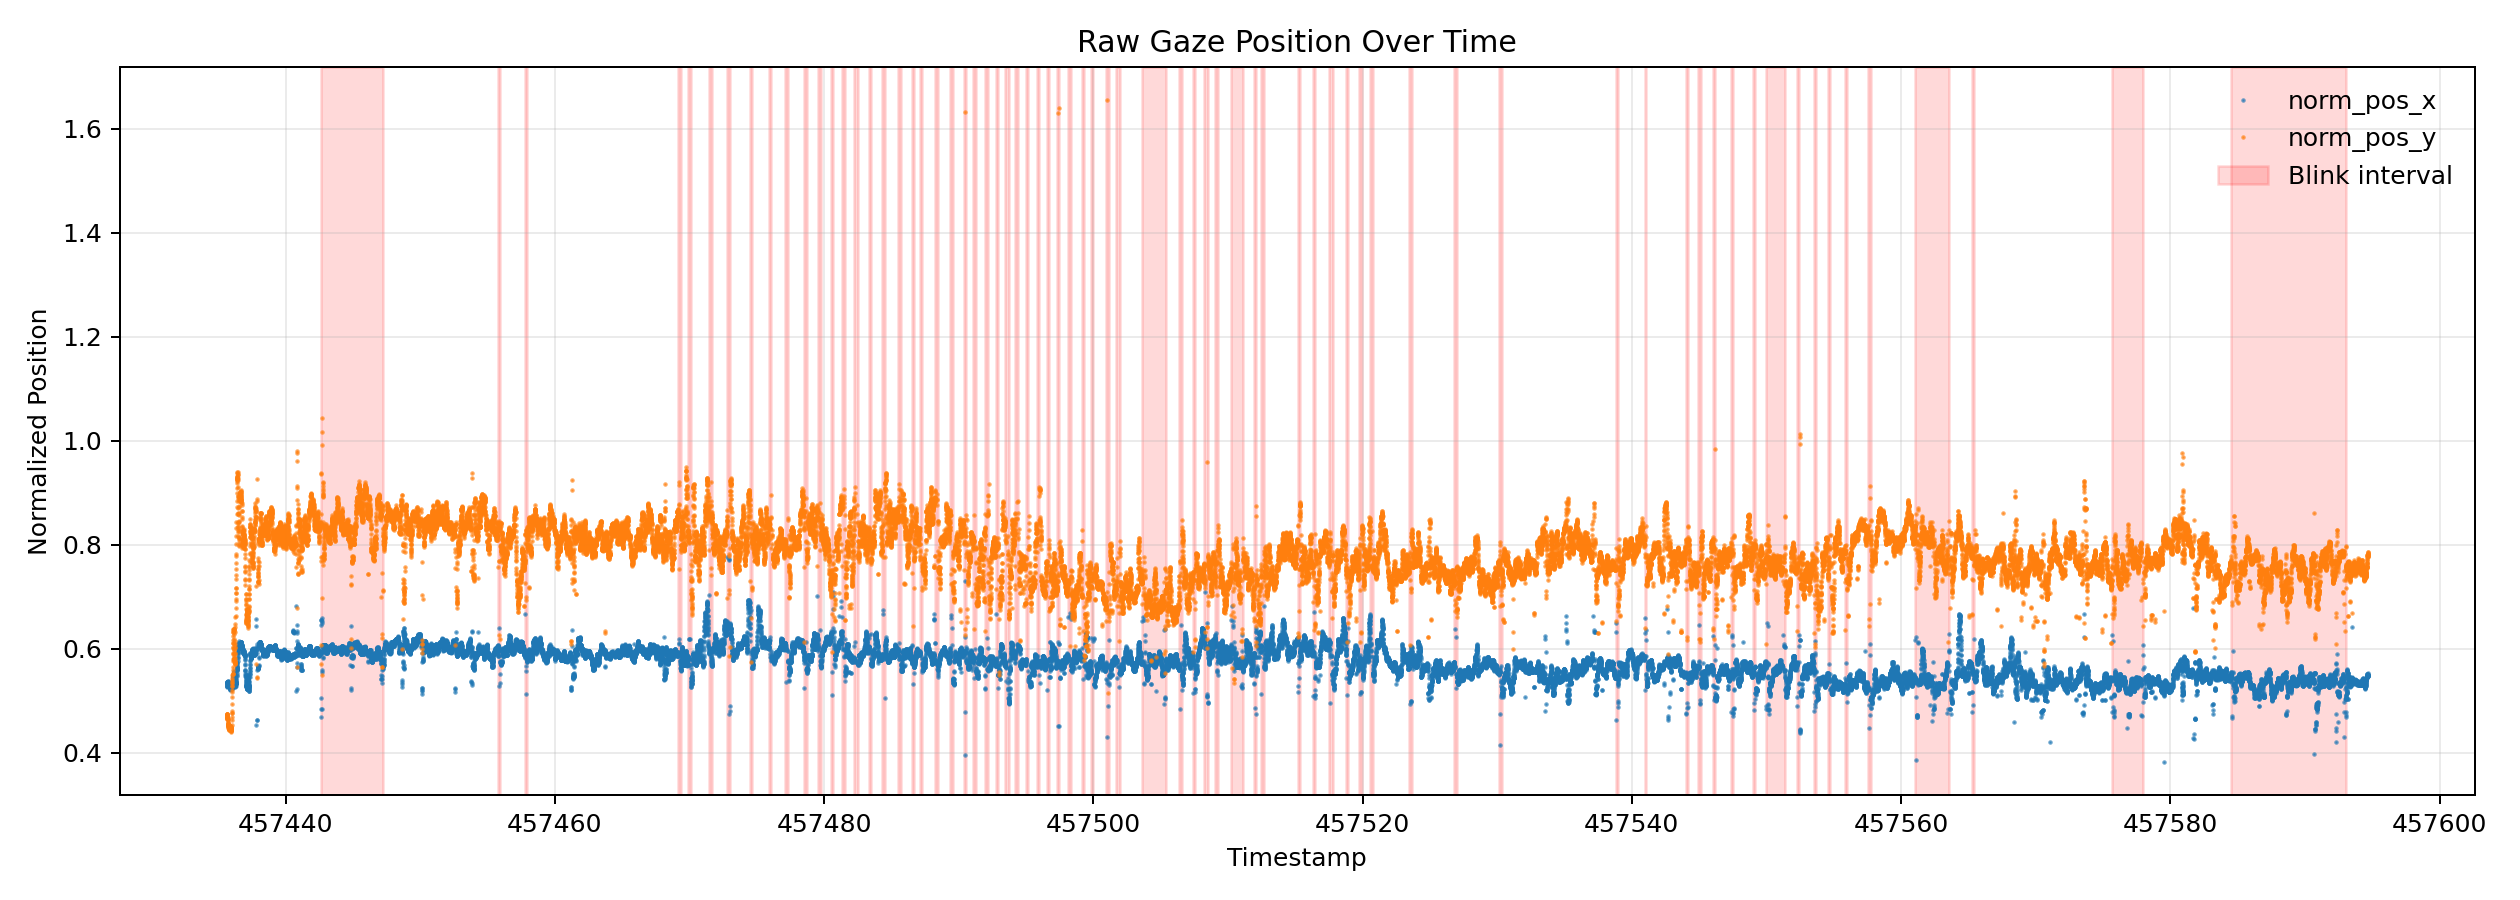
1. **Raw Gaze Scatter Over Time**
Two traces (
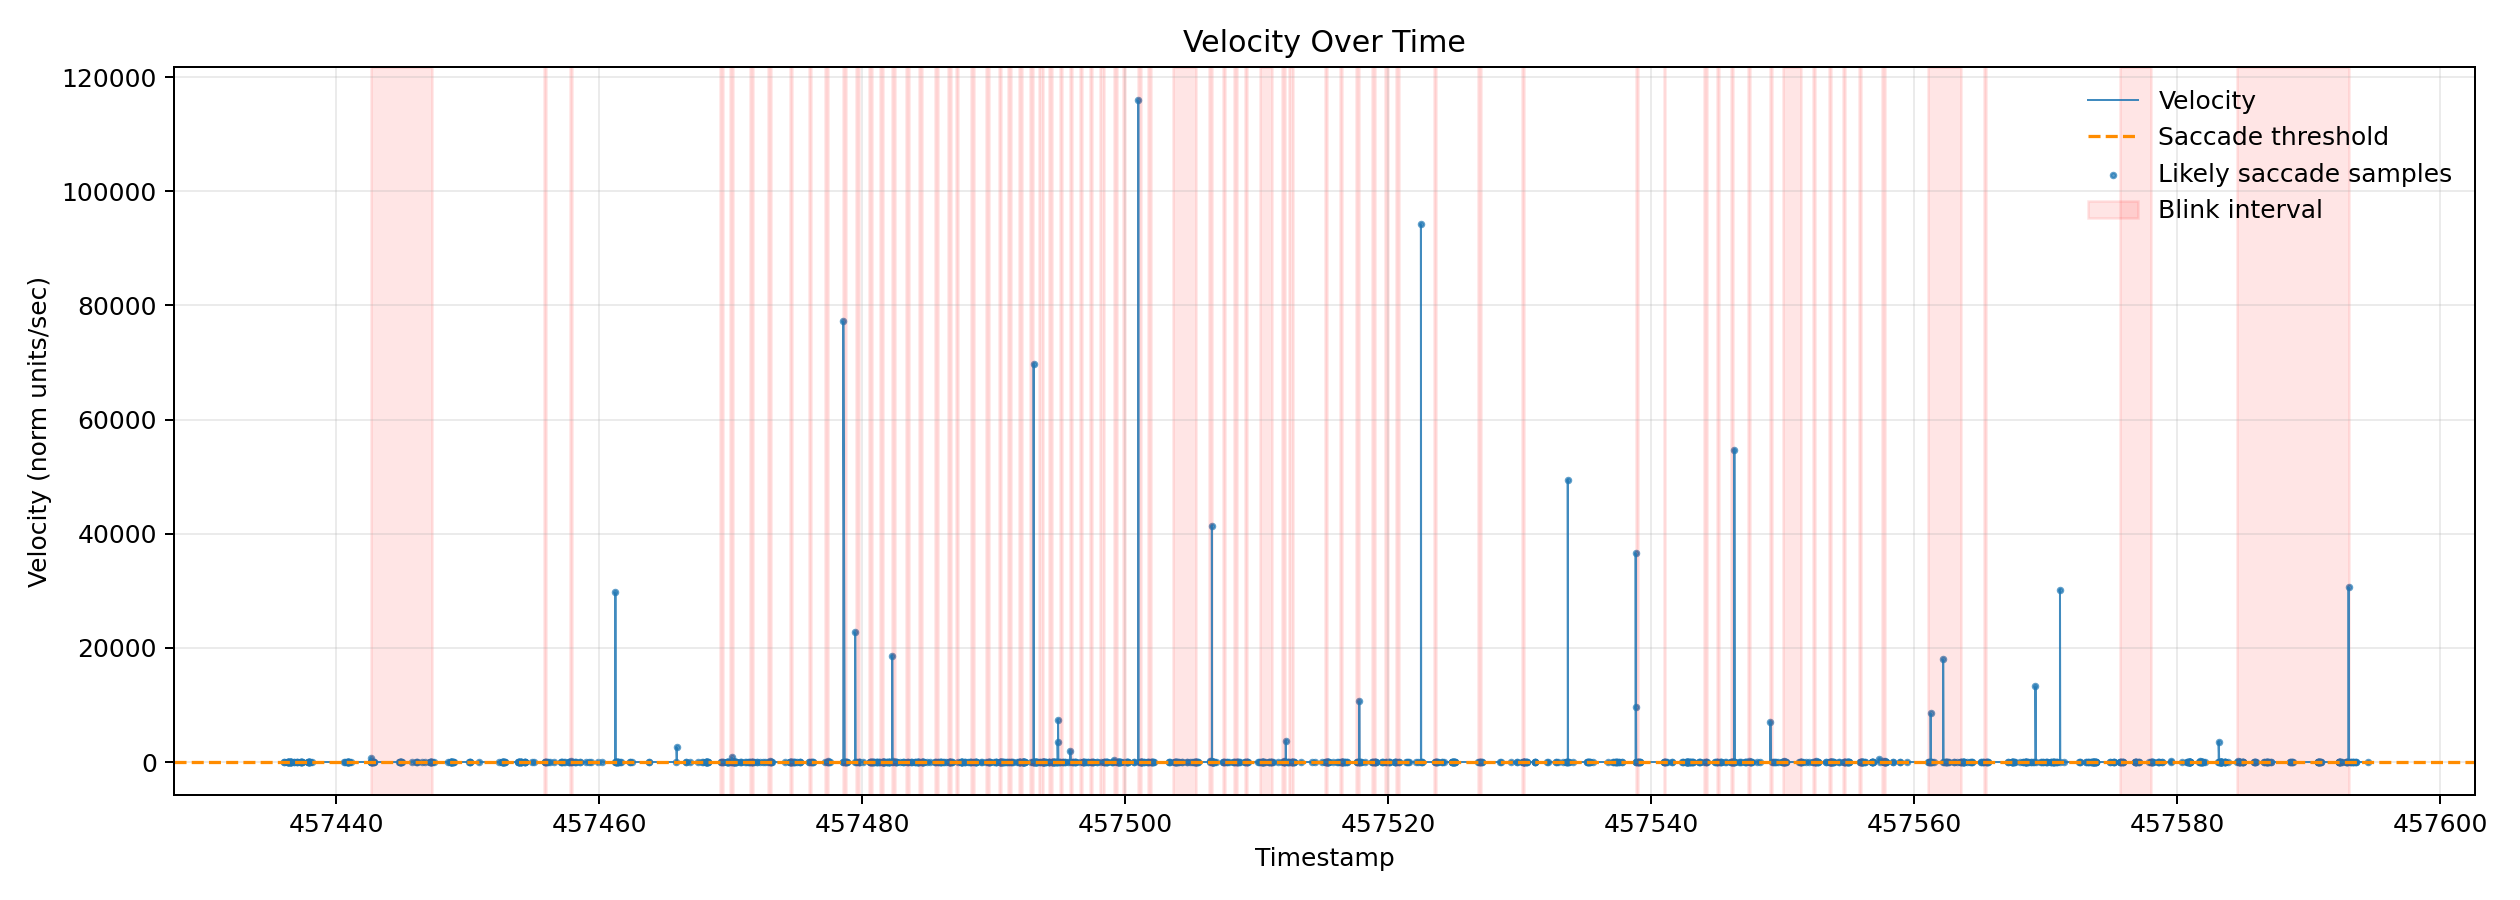
2. **Velocity Plot**
Velocity over time with threshold line and saccade points highlighted.
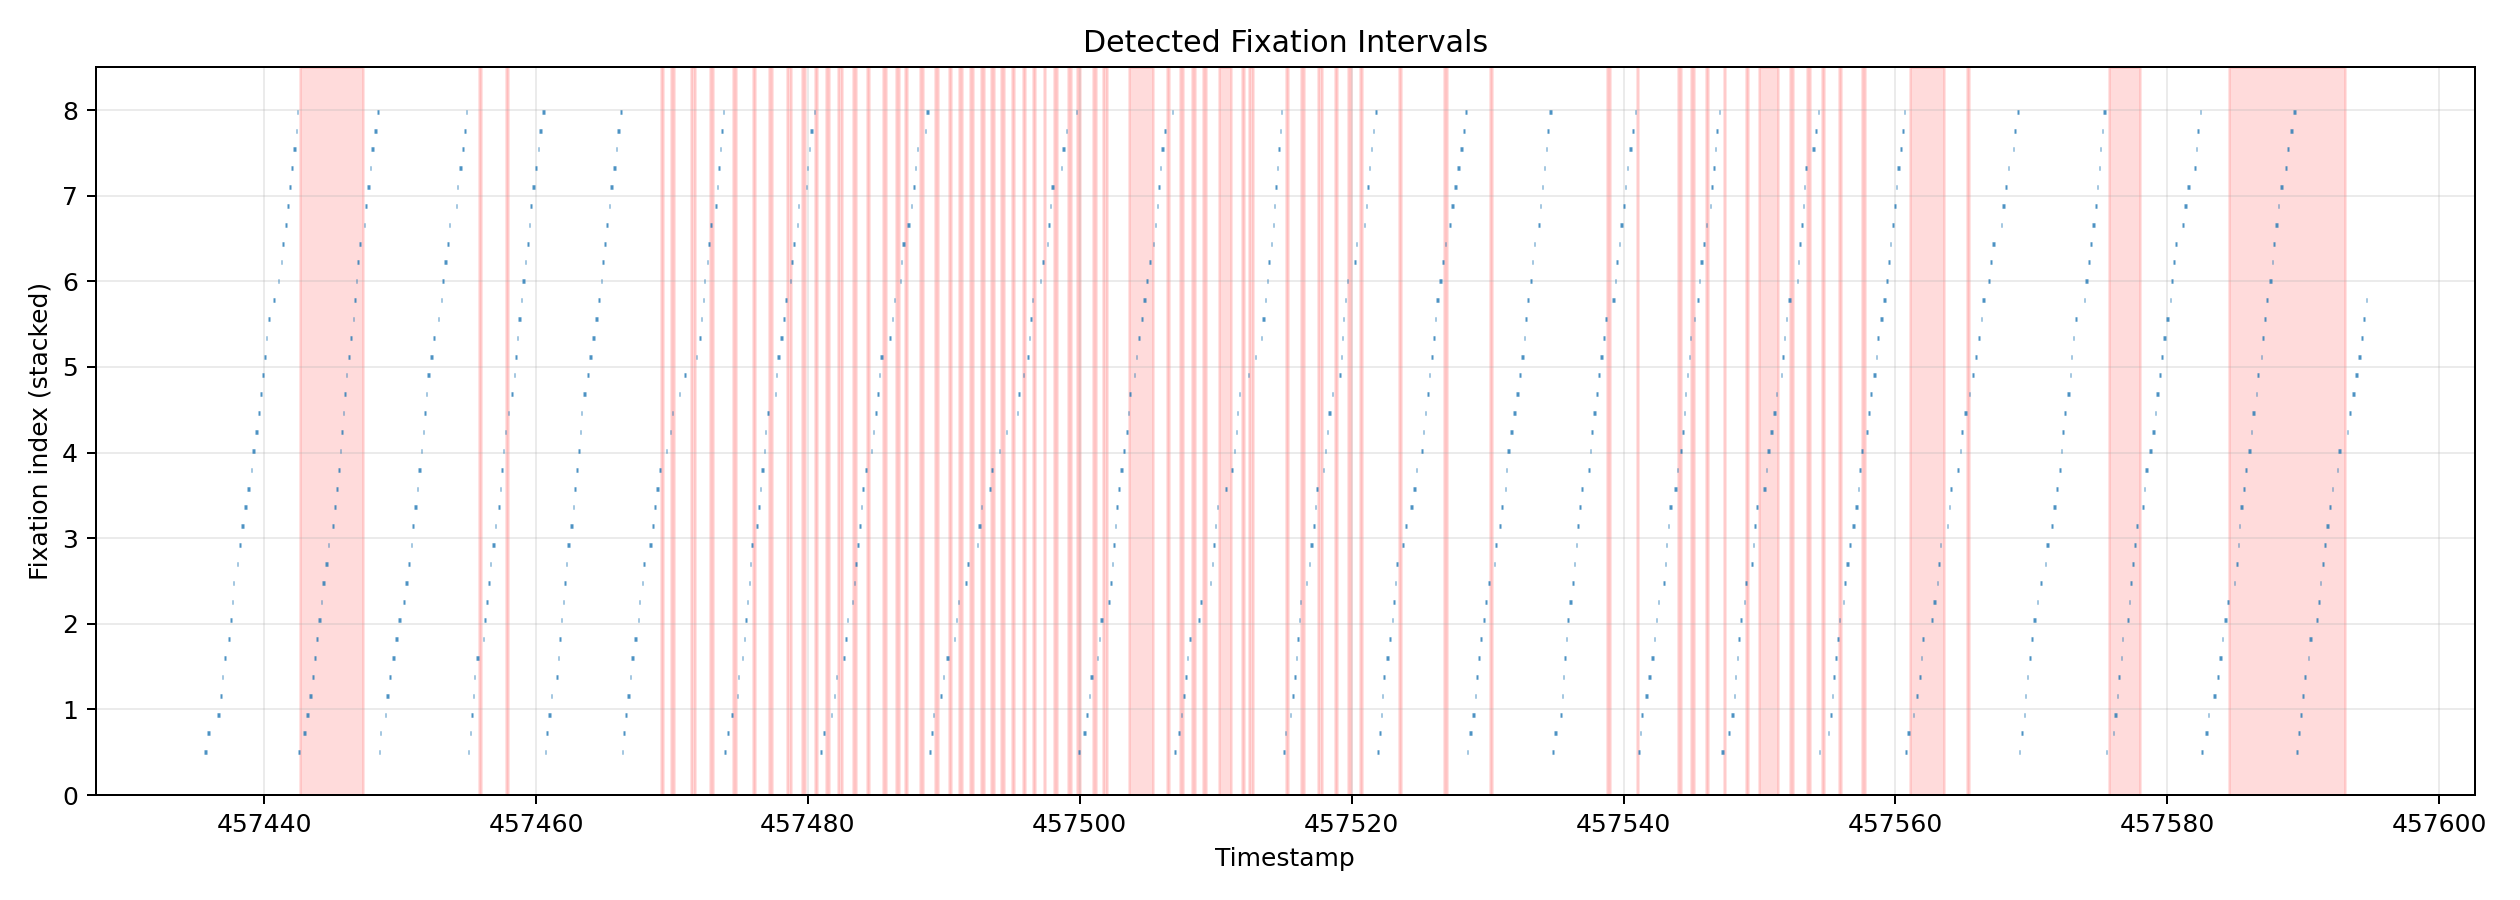
3. **Detected Fixation Intervals**
Horizontal timeline bands showing start/end of each fixation, plus blink overlays.
These visuals show students how raw data becomes interpretable events.
- load gaze samples
- remove low-confidence points
- sort by timestamp
- compute sample-to-sample velocity from normalized coordinates
Velocity is computed as:
- distance between consecutive gaze points divided by time difference
This gives a direct measure of fast eye movement bursts (likely saccades) versus slower stable periods (likely fixations).
Next, we overlay blink intervals from
"blinks.csv" and derive a simple saccade mask from velocity thresholding:- robust threshold =
"median(velocity) + 6 * MAD"This is practical for classroom teaching because:
- easy to explain
- robust to outliers
- adapts to each recording
We then generate:
1. **Raw Gaze Scatter Over Time**
Two traces (
"norm_pos_x", "norm_pos_y") against time with blink windows highlighted.2. **Velocity Plot**
Velocity over time with threshold line and saccade points highlighted.
3. **Detected Fixation Intervals**
Horizontal timeline bands showing start/end of each fixation, plus blink overlays.
These visuals show students how raw data becomes interpretable events.
"""
@author: Fjorda
"""
from pathlib import Path
import argparse
import matplotlib.pyplot as plt
import numpy as np
import pandas as pd
def mad(x: np.ndarray) -> float:
med = np.median(x)
return np.median(np.abs(x - med))
def add_interval_spans(ax, intervals, color, alpha=0.18, label=None):
first = True
for start, end in intervals:
if np.isfinite(start) and np.isfinite(end) and end >= start:
ax.axvspan(start, end, color=color, alpha=alpha, label=label if first else None)
first = False
def parse_args():
script_dir = Path(__file__).resolve().parent
parser = argparse.ArgumentParser(
description="Convert raw gaze CSV data to fixation/saccade visualizations."
)
parser.add_argument(
"--gaze",
type=Path,
default=script_dir / "gaze_positions.csv",
help="Path to gaze_positions.csv (default: script folder/gaze_positions.csv)",
)
parser.add_argument(
"--fixations",
type=Path,
default=script_dir / "fixations.csv",
help="Path to fixations.csv (default: script folder/fixations.csv)",
)
parser.add_argument(
"--blinks",
type=Path,
default=script_dir / "blinks.csv",
help="Path to blinks.csv (default: script folder/blinks.csv)",
)
parser.add_argument(
"--out-dir",
type=Path,
default=script_dir / "outputs",
help="Folder to save output plots (default: script folder/outputs)",
)
return parser.parse_args()
def main():
args = parse_args()
gaze_path = args.gaze.expanduser().resolve()
fix_path = args.fixations.expanduser().resolve()
blink_path = args.blinks.expanduser().resolve()
out_dir = args.out_dir.expanduser().resolve()
out_dir.mkdir(parents=True, exist_ok=True)
if not gaze_path.exists():
raise FileNotFoundError(f"Missing gaze file: {gaze_path}")
if not fix_path.exists():
raise FileNotFoundError(f"Missing fixations file: {fix_path}")
gaze = pd.read_csv(gaze_path)
fix = pd.read_csv(fix_path)
if blink_path.exists():
blinks = pd.read_csv(blink_path)
else:
blinks = pd.DataFrame(columns=["start_timestamp", "end_timestamp"])
print(f"Blink file not found. Continuing without blink overlays: {blink_path}")
# Keep core fields and remove low-confidence gaze points.
gaze = gaze[["gaze_timestamp", "norm_pos_x", "norm_pos_y", "confidence"]].copy()
gaze = gaze.dropna(subset=["gaze_timestamp", "norm_pos_x", "norm_pos_y"])
gaze = gaze[gaze["confidence"] >= 0.6].sort_values("gaze_timestamp").reset_index(drop=True)
t = gaze["gaze_timestamp"].to_numpy()
x = gaze["norm_pos_x"].to_numpy()
y = gaze["norm_pos_y"].to_numpy()
dt = np.diff(t)
dx = np.diff(x)
dy = np.diff(y)
dist = np.sqrt(dx * dx + dy * dy)
# Velocity in normalized coordinate units / second.
velocity = np.full_like(t, np.nan, dtype=float)
valid_dt = dt > 0
vel_core = np.full_like(dt, np.nan, dtype=float)
vel_core[valid_dt] = dist[valid_dt] / dt[valid_dt]
velocity[1:] = vel_core
vel_valid = velocity[np.isfinite(velocity)]
vel_med = np.median(vel_valid)
vel_mad = mad(vel_valid)
saccade_threshold = vel_med + 6.0 * vel_mad
saccade_mask = velocity > saccade_threshold
# Build blink and fixation intervals for plotting.
blink_intervals = []
if {"start_timestamp", "end_timestamp"}.issubset(blinks.columns):
for _, r in blinks[["start_timestamp", "end_timestamp"]].dropna().iterrows():
blink_intervals.append((float(r["start_timestamp"]), float(r["end_timestamp"])))
fix_intervals = []
fix_cols = set(fix.columns)
if {"start_timestamp", "end_timestamp"}.issubset(fix_cols):
temp = fix[["start_timestamp", "end_timestamp"]].dropna()
for _, r in temp.iterrows():
fix_intervals.append((float(r["start_timestamp"]), float(r["end_timestamp"])))
elif {"start_timestamp", "duration"}.issubset(fix_cols):
temp = fix[["start_timestamp", "duration"]].dropna()
for _, r in temp.iterrows():
start = float(r["start_timestamp"])
end = start + (float(r["duration"]) / 1000.0)
fix_intervals.append((start, end))
# Figure 1: raw gaze over time.
fig1, ax1 = plt.subplots(figsize=(14, 5))
ax1.plot(t, x, ".", markersize=1.6, alpha=0.65, label="norm_pos_x")
ax1.plot(t, y, ".", markersize=1.6, alpha=0.65, label="norm_pos_y")
add_interval_spans(ax1, blink_intervals, color="red", alpha=0.15, label="Blink interval")
ax1.set_title("Raw Gaze Position Over Time")
ax1.set_xlabel("Timestamp")
ax1.set_ylabel("Normalized Position")
ax1.legend(loc="upper right", frameon=False)
ax1.grid(alpha=0.25)
fig1.tight_layout()
fig1.savefig(out_dir / "raw_gaze_over_time.png", dpi=180)
plt.close(fig1)
# Figure 2: velocity with threshold and saccade points.
fig2, ax2 = plt.subplots(figsize=(14, 5))
ax2.plot(t, velocity, linewidth=0.8, alpha=0.85, label="Velocity")
ax2.axhline(saccade_threshold, linestyle="--", linewidth=1.3, color="darkorange", label="Saccade threshold")
ax2.scatter(t[saccade_mask], velocity[saccade_mask], s=4, alpha=0.7, label="Likely saccade samples")
add_interval_spans(ax2, blink_intervals, color="red", alpha=0.1, label="Blink interval")
ax2.set_title("Velocity Over Time")
ax2.set_xlabel("Timestamp")
ax2.set_ylabel("Velocity (norm units/sec)")
ax2.legend(loc="upper right", frameon=False)
ax2.grid(alpha=0.25)
fig2.tight_layout()
fig2.savefig(out_dir / "velocity_with_threshold.png", dpi=180)
plt.close(fig2)
# Figure 3: fixation intervals timeline.
fig3, ax3 = plt.subplots(figsize=(14, 5))
if fix_intervals:
y0 = 0.5
for i, (start, end) in enumerate(fix_intervals):
y_level = y0 + (i % 35) * 0.22
ax3.hlines(y=y_level, xmin=start, xmax=end, linewidth=1.8, alpha=0.8, color="tab:blue")
add_interval_spans(ax3, blink_intervals, color="red", alpha=0.14, label="Blink interval")
ax3.set_title("Detected Fixation Intervals")
ax3.set_xlabel("Timestamp")
ax3.set_ylabel("Fixation index (stacked)")
ax3.grid(alpha=0.25)
if fix_intervals:
ax3.set_ylim(0, 8.5)
fig3.tight_layout()
fig3.savefig(out_dir / "fixation_intervals.png", dpi=180)
plt.close(fig3)
print(f"Gaze samples used: {len(gaze):,}")
print(f"Fixation intervals: {len(fix_intervals):,}")
print(f"Blink intervals: {len(blink_intervals):,}")
print(f"Velocity median: {vel_med:.4f}")
print(f"Velocity MAD: {vel_mad:.4f}")
print(f"Saccade threshold: {saccade_threshold:.4f}")
print(f"Likely saccade samples: {int(np.nansum(saccade_mask)):,}")
print(f"Saved figures to: {out_dir}")
if __name__ == "__main__":
main()
After we run the above script, we will visualise fixation intervals, raw gaze data over time, velocity with threshold (see below).
Conclusions
- Raw gaze points are noisy, but still contain clear temporal structure.
- Velocity transforms the raw stream into movement dynamics, helping separate likely saccades from stable viewing.
- Fixation intervals provide an interpretable summary of visual attention behavior.
- With these plots, you can directly connect measurement noise to cognitive interpretation.