Blink Activity Timeline in Python (Pupil Labs)
This guide shows how to turn blink events from Pupil Labs exports into a synchronized two-panel animation: a rolling blink-rate curve and an accumulating event strip. No background image is required.
By the end, you will generate:
- An animated GIF (
- A small summary table (
Note. This workflow expects a Pupil Labs CSV export
Download blinks.csv
Download blink summary table
By the end, you will generate:
- An animated GIF (
blink_activity_timeline.gif) with rolling blink rate and blink onsets over time
- A small summary table (
blink_activity_summary.csv)
Note. This workflow expects a Pupil Labs CSV export
blinks.csv. Time is shown as seconds since recording start for readability.Download blinks.csv
Download blink summary table
Requirements
- Anaconda Python Development Environment
-
- Python packages:
-
-
-
-
-
blinks.csv exported from Pupil Labs- Python packages:
-
pandas-
numpy-
matplotlib-
Pillow (usually included with Anaconda; used for writing the GIF)
Setup
1. Install Anaconda if needed.
2. Open Spyder, Jupyter Notebook, or VS Code.
3. Put
4. Save the script in the same folder (or a folder of your choice and pass paths on the command line).
To use Spyder, install Anaconda, run it, and launch Spyder. If you see Install instead of Launch for Spyder, install Spyder first. Create a new file in Spyder and save it in the same directory as your data when you run the examples below.
2. Open Spyder, Jupyter Notebook, or VS Code.
3. Put
blinks.csv in your working folder (or pass a path with --blinks).4. Save the script in the same folder (or a folder of your choice and pass paths on the command line).
To use Spyder, install Anaconda, run it, and launch Spyder. If you see Install instead of Launch for Spyder, install Spyder first. Create a new file in Spyder and save it in the same directory as your data when you run the examples below.
Step 1 Data
We start with blink events exported by Pupil Labs.
Important variables from
-
- optional:
- optional:
Important variables from
blinks.csv: -
start_timestamp, duration (blink timing)- optional:
end_timestamp (if missing, it is computed from start + duration)- optional:
confidence (filter with --confidence-threshold)Step 2 Build the two-panel animation
In this step, you:
1. Load
2. Filter low-confidence events where available
3. Convert duration units if needed (milliseconds to seconds when values look large)
4. Compute a rolling blink rate (blinks per minute) over a trailing time window
5. Render frames with a moving time cursor on both panels and save a GIF
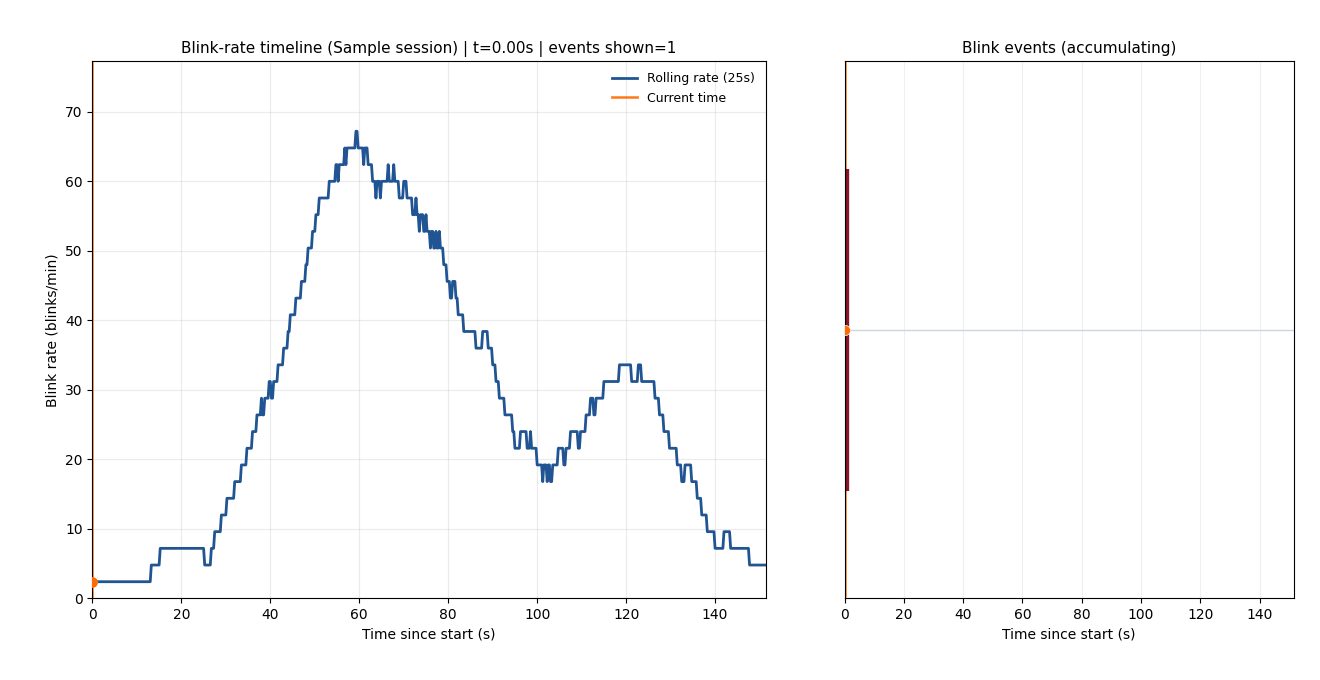
The left panel shows how local blink rate changes over time; the right panel shows blink onsets as vertical bars whose thickness reflects duration.
1. Load
blinks.csv2. Filter low-confidence events where available
3. Convert duration units if needed (milliseconds to seconds when values look large)
4. Compute a rolling blink rate (blinks per minute) over a trailing time window
5. Render frames with a moving time cursor on both panels and save a GIF
The left panel shows how local blink rate changes over time; the right panel shows blink onsets as vertical bars whose thickness reflects duration.
Step 3 Generate outputs
1. Write
2. Write
Outputs are saved to your
blink_activity_timeline.gif (animated figure)2. Write
blink_activity_summary.csv (blink count, overall rate, duration and inter-blink interval summaries)Outputs are saved to your
outputs folder by default.
Step 5 Code
Use the script file below. It loads blink start times and durations, computes a rolling blink rate for the left panel, and draws accumulating blink markers for the right panel.
"""
@author: Fjorda
"""
from __future__ import annotations
import argparse
from pathlib import Path
import matplotlib.pyplot as plt
import numpy as np
import pandas as pd
from PIL import Image
SCRIPT_DIR = Path(__file__).resolve().parent
DEFAULT_BLINKS = SCRIPT_DIR / "blinks.csv"
DEFAULT_OUT = SCRIPT_DIR / "outputs"
def parse_args() -> argparse.Namespace:
parser = argparse.ArgumentParser(description="Tutorial 7: Blink activity timeline GIF")
parser.add_argument("--blinks", type=Path, default=DEFAULT_BLINKS, help="Path to blinks.csv")
parser.add_argument("--label", type=str, default="Session")
parser.add_argument("--out-dir", type=Path, default=DEFAULT_OUT)
parser.add_argument("--confidence-threshold", type=float, default=0.0)
parser.add_argument("--rolling-window-sec", type=float, default=25.0)
parser.add_argument("--time-step-sec", type=float, default=0.25, help="Frame spacing in seconds")
parser.add_argument("--fps", type=int, default=10)
parser.add_argument("--time-padding-sec", type=float, default=1.0)
parser.add_argument("--time-max-sec", type=float, default=None)
return parser.parse_args()
def _resolve_existing(path: Path, name: str) -> Path:
p = path.expanduser().resolve()
if not p.is_file():
raise FileNotFoundError(f"{name} not found: {p}")
return p
def load_blinks(path: Path, conf_thr: float) -> pd.DataFrame:
df = pd.read_csv(path)
required = {"start_timestamp", "duration"}
missing = required - set(df.columns)
if missing:
raise ValueError(f"Missing blink columns: {sorted(missing)}")
if "confidence" in df.columns:
df = df[df["confidence"] >= conf_thr].copy()
df = df.dropna(subset=["start_timestamp", "duration"]).copy()
df["start_timestamp"] = df["start_timestamp"].astype(float)
df["duration"] = df["duration"].astype(float)
# duration is often in seconds in Pupil exports; if it looks like ms, convert.
if np.nanmedian(df["duration"].to_numpy(dtype=float)) > 10.0:
df["duration"] = df["duration"] / 1000.0
if "end_timestamp" in df.columns:
df["end_timestamp"] = df["end_timestamp"].astype(float)
else:
df["end_timestamp"] = df["start_timestamp"] + df["duration"]
df = df[df["duration"] > 0].copy()
df = df.sort_values("start_timestamp").reset_index(drop=True)
return df
def _rolling_blink_rate(times: np.ndarray, starts: np.ndarray, window_sec: float) -> np.ndarray:
"""Blink-rate over time: count starts in trailing window, scaled to blinks/min."""
left = np.searchsorted(starts, times - window_sec, side="left")
right = np.searchsorted(starts, times, side="right")
counts = right - left
return counts * (60.0 / max(window_sec, 1e-9))
def _save_gif(frames: list[Image.Image], out_path: Path, fps: int) -> None:
if not frames:
raise ValueError("No frames generated")
duration_ms = int(1000 / max(1, fps))
frames[0].save(
out_path,
save_all=True,
append_images=frames[1:],
loop=0,
duration=[duration_ms] * len(frames),
)
def build_gif(
blinks: pd.DataFrame,
label: str,
out_path: Path,
fps: int,
rolling_window_sec: float,
time_step_sec: float,
time_padding_sec: float,
time_max_sec: float | None,
) -> dict:
start_abs = blinks["start_timestamp"].to_numpy(dtype=float)
end_abs = blinks["end_timestamp"].to_numpy(dtype=float)
dur = blinks["duration"].to_numpy(dtype=float)
t0 = float(start_abs[0])
starts = start_abs - t0
ends = end_abs - t0
t_end_data = float(max(ends[-1], starts[-1]))
if time_max_sec is None:
x_max = max(t_end_data + max(time_padding_sec, 0.0), 1.0)
else:
x_max = max(float(time_max_sec), t_end_data, 1.0)
frame_times = np.arange(0.0, x_max + max(time_step_sec, 1e-3), max(time_step_sec, 1e-3))
if len(frame_times) == 0 or frame_times[-1] < x_max:
frame_times = np.append(frame_times, x_max)
rates = _rolling_blink_rate(frame_times, starts, max(rolling_window_sec, 1.0))
fig = plt.figure(figsize=(13.2, 6.8))
gs = fig.add_gridspec(1, 2, width_ratios=[1.2, 0.8], wspace=0.14)
ax_rate = fig.add_subplot(gs[0, 0])
ax_events = fig.add_subplot(gs[0, 1])
fig.subplots_adjust(left=0.07, right=0.98, bottom=0.12, top=0.91, wspace=0.14)
ax_rate.plot(frame_times, rates, color="#205493", linewidth=2.0, label=f"Rolling rate ({rolling_window_sec:g}s)")
cursor_rate = ax_rate.axvline(0.0, color="#ff6b00", linewidth=1.8, alpha=0.9, label="Current time")
marker_rate = ax_rate.scatter([0.0], [rates[0]], s=45, c="#ff6b00", zorder=5)
ax_rate.set_xlim(0, x_max)
y_top = max(float(np.max(rates) * 1.15), 2.0)
ax_rate.set_ylim(0, y_top)
ax_rate.set_xlabel("Time since start (s)")
ax_rate.set_ylabel("Blink rate (blinks/min)")
ax_rate.grid(alpha=0.25)
ax_rate.legend(loc="upper right", frameon=False, fontsize=9)
ax_rate.set_title(f"Blink-rate timeline ({label})", fontsize=11)
ax_events.set_xlim(0, x_max)
ax_events.set_ylim(0, 1)
ax_events.set_xlabel("Time since start (s)")
ax_events.set_yticks([])
ax_events.grid(axis="x", alpha=0.2)
ax_events.set_title("Blink events (accumulating)", fontsize=11)
base_line = ax_events.hlines(0.5, 0, x_max, color="#ccd6e0", linewidth=1.0)
_ = base_line # keep artist handle for completeness
cursor_evt = ax_events.axvline(0.0, color="#ff6b00", linewidth=1.8, alpha=0.9)
bars = ax_events.vlines([], 0.2, 0.8, colors="#7a0018", linewidth=2.0, alpha=0.9)
current_evt = ax_events.scatter([], [], s=52, c="#ff6b00", zorder=6, edgecolors="white", linewidths=0.5)
frames: list[Image.Image] = []
for i, t in enumerate(frame_times):
cursor_rate.set_xdata([t, t])
marker_rate.set_offsets(np.array([[t, rates[i]]], dtype=float))
cursor_evt.set_xdata([t, t])
done = starts <= t
s_done = starts[done]
d_done = dur[done]
lw = np.clip(d_done * 45.0, 1.3, 6.0)
bars.set_segments([[(x, 0.2), (x, 0.8)] for x in s_done])
bars.set_linewidths(lw)
active = (starts <= t) & (ends >= t)
if np.any(active):
x_active = starts[active]
current_evt.set_offsets(np.c_[x_active, np.full_like(x_active, 0.5)])
else:
current_evt.set_offsets(np.empty((0, 2)))
ax_rate.set_title(
f"Blink-rate timeline ({label}) | t={t:.2f}s | events shown={int(np.sum(done))}",
fontsize=11,
)
fig.canvas.draw()
w, h = fig.canvas.get_width_height()
arr = np.frombuffer(fig.canvas.buffer_rgba(), dtype=np.uint8).reshape(h, w, 4)
frames.append(Image.fromarray(arr[..., :3]))
_save_gif(frames, out_path, fps=fps)
plt.close(fig)
ibi = np.diff(starts) if len(starts) >= 2 else np.array([], dtype=float)
overall_rate = float(len(starts) / max(x_max, 1e-9) * 60.0)
return {
"label": label,
"n_blinks": int(len(starts)),
"timeline_end_s": float(x_max),
"rolling_window_sec": float(rolling_window_sec),
"blink_rate_per_min": overall_rate,
"blink_duration_mean_s": float(np.mean(dur)) if len(dur) else 0.0,
"blink_duration_median_s": float(np.median(dur)) if len(dur) else 0.0,
"ibi_mean_s": float(np.mean(ibi)) if len(ibi) else np.nan,
"ibi_median_s": float(np.median(ibi)) if len(ibi) else np.nan,
}
def main() -> None:
args = parse_args()
blinks_path = _resolve_existing(args.blinks, "Blinks file")
out_dir = args.out_dir.expanduser().resolve()
out_dir.mkdir(parents=True, exist_ok=True)
blinks = load_blinks(blinks_path, conf_thr=args.confidence_threshold)
if len(blinks) == 0:
raise ValueError("No blink events after filtering. Lower threshold or check file.")
summary = build_gif(
blinks=blinks,
label=args.label,
out_path=out_dir / "blink_activity_timeline.gif",
fps=args.fps,
rolling_window_sec=args.rolling_window_sec,
time_step_sec=args.time_step_sec,
time_padding_sec=args.time_padding_sec,
time_max_sec=args.time_max_sec,
)
pd.DataFrame([summary]).to_csv(out_dir / "blink_activity_summary.csv", index=False)
print(f"Outputs saved to: {out_dir}")
print(f"Blinks used: {blinks_path}")
if __name__ == "__main__":
main()
After you run the script, you will obtain the outputs listed in Step 4. The preview below uses the same asset path as on this site (replace it with your generated GIF when you upload assets).